Kodeclik Blog
numpy.percentile() in Python
Let's suppose we are given data about students’ scores in a class and we wish to understand this data in terms of percentiles. numpy.percentile() is a handy function in Python’s numpy library for this purpose!
What is a percentile?
A percentile is a measure used in statistics to indicate the value below which a given percentage of observations in a group of observations falls. Do not confuse percentiles with percentages! (To recap what a percentage is, learn how to convert a decimal to a percentage.)
Specifically, the pth percentile is the value below which "p" percent of the observations may be found. For example, the 25th percentile is the value below which 25% of the observations fall. Similarly, the 50th percentile is the median value, with 50% of observations falling below it. The 90th percentile is the value below which 90% of the observations are found, and so on.
Essentially, percentiles divide an ordered data set into 100 equal groups. They provide a way to gauge where a specific data point stands relative to the entire distribution. Higher percentile values represent higher ranks within the data.
Percentiles thus range from 0 to 100, with 0 being the minimum value and 100 being the maximum value.
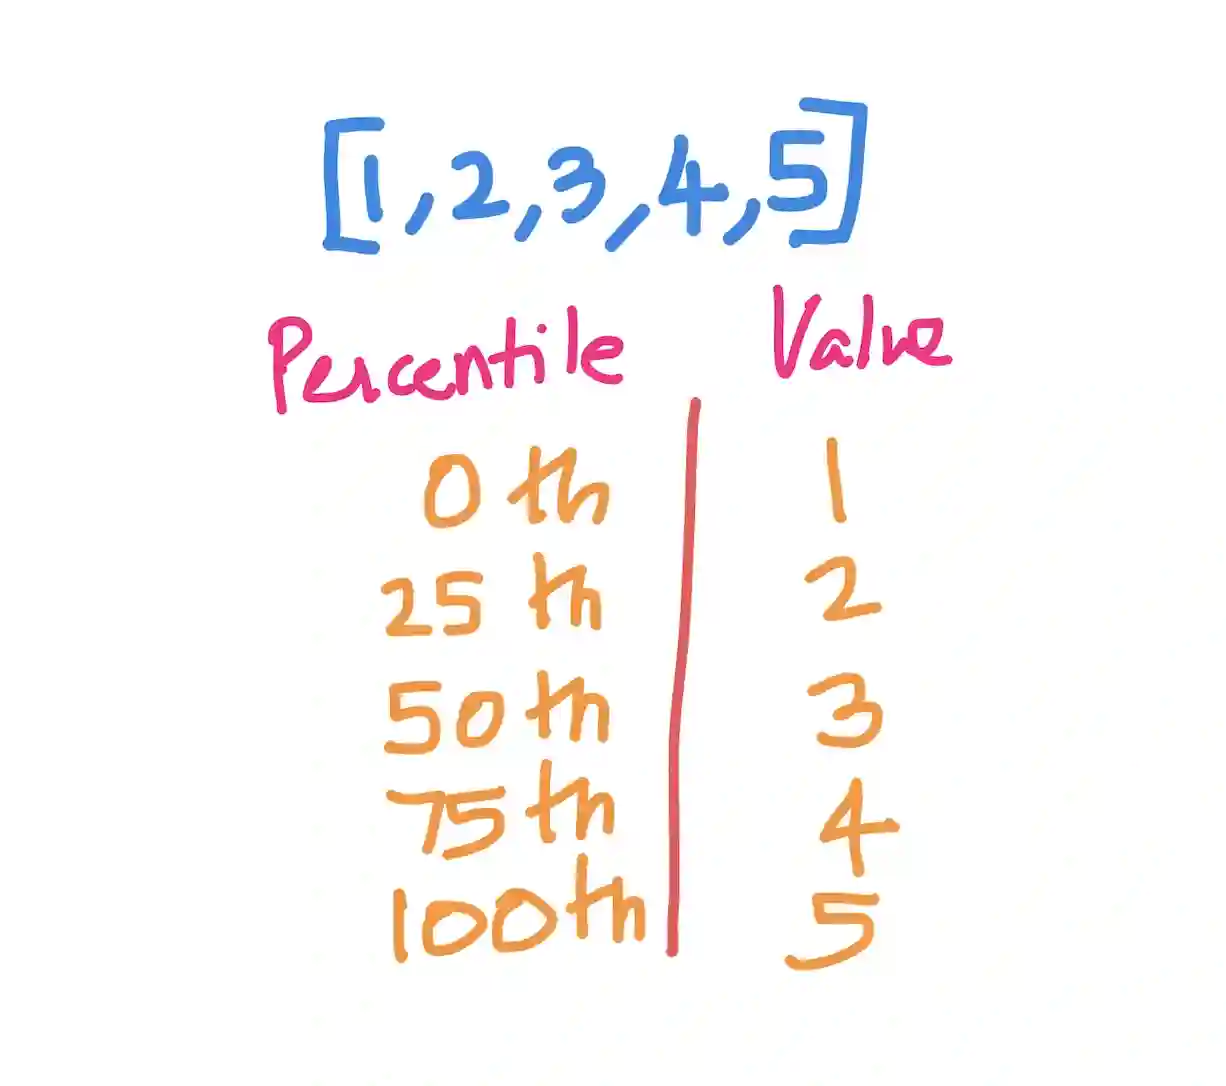
Chances are you have already encountered percentiles but do not know it yet! If you have an array such as [1,2,3,4,5] and you wish to find the median value in this array. The median is 3; it is also known as the 50th percentile because 50% of the values are below it (ie less than 3) and 50% of the values are above it (ie greater than 3). Similarly, the 75th percentile is 4 because 75% of the values are less than 4. The below figure shows the full list of percentiles for this data.
Example 1: Find the 50th percentile in a 1D array
Recall that the 50th percentile is the value that separates the higher half of a dataset from the lower half, and thus the median value.
Consider the below Python program to find the 50th percentile using the np.percentile() function. In this version np.percentile() takes just two arguments - the array containing the data, and the number 50 (denoting the 50th percentile).
import numpy as np

scores = np.array([90, 92, 95, 85, 75, 78, 83,
                   85, 99, 100, 67, 68, 78, 84])

median_score = np.percentile(scores, 50)
print(f"The median score is: {median_score}")
The output will be:
The median score is: 84.5This means that 50% of students scored lower than 84.5 and 50% of students scored higher than 84.5 (check it out for yourself!)
Example 2: Find the 100th percentile in a 1D array
Just as 50th percentile denotes the median value, the 100th percentile denotes the maximum value. So, if we do:
import numpy as np

scores = np.array([90, 92, 95, 85, 75, 78, 83,
                   85, 99, 100, 67, 68, 78, 84])

highest_score = np.percentile(scores, 100)
print(f"The highest score is: {highest_score}")
we will get:
The highest score is: 100.0as expected.
How are percentiles different from quartiles?
Percentiles and quartiles are related but distinct statistical measures used to describe the position or ranking of a data point within a distribution. One key difference between them is that percentiles divide a dataset into 100 equal parts but quartiles divide a dataset into 4 equal parts.
The first quartile (Q1) is the 25th percentile, the value below which 25% of the data lies.. Similarly, the second quartile (Q2) is the 50th percentile, which is the median value. The third quartile (Q3) is the 75th percentile, the value below which 75% of the data lies. Thus, quartiles range from 0 to 4, with 0 being the minimum and 4 being the maximum.
Percentiles are more useful for large datasets where the additional granularity is valuable, while quartiles offer a simpler summary for smaller datasets or when a broad overview is sufficient.
What is the difference between a percentile and a percentage?
A percentage represents a ratio or proportion of a whole, expressed out of 100. For example, getting 80% on a test means you got 80 out of 100 questions correct.
A percentile, on the other hand, indicates the relative position or ranking of a data point within a distribution. If your percentile on a test is 80%, it means 80% of students scored lower than you (but your score could be as low as 50 or even 30, for instance!).
Example 3: Finding multiple percentiles
Consider the below code which is an updated version of the above programs:
import numpy as np

scores = np.array([90, 92, 95, 85, 75, 78, 83,
                   85, 99, 100, 67, 68, 78, 84])
percentiles = np.arange(0, 101, 10)

# Generate percentiles from 0 to 100 in steps of 10
score_percentiles = np.percentile(scores, percentiles)

print("Percentile Scores:")
for i, p in enumerate(percentiles):
    print(f"{p}th percentile: {score_percentiles[i]}")

# Print the highest and lowest scores
highest_score = np.max(scores)
lowest_score = np.min(scores)
print(f"\nThe highest score is: {highest_score}")
print(f"The lowest score is: {lowest_score}")
As you can notice, the updated code calculates and displays multiple percentile scores for a given array of scores, along with the highest and lowest scores in the dataset.
In the first part, the code generates an array of percentiles ranging from 0 to 100 in steps of 10 using np.arange(0, 101, 10). It then uses np.percentile(scores, percentiles) to compute the corresponding scores for each of these percentiles. The code iterates over the percentiles and their corresponding scores, printing them in a formatted string that displays the percentile value and the corresponding score. This provides a comprehensive overview of the distribution of scores at different percentile levels.
In the second part, the code finds the highest and lowest scores in the dataset using np.max(scores) and np.min(scores), respectively. These values are then printed, providing additional context about the range of scores in the dataset. By combining the percentile scores and the highest/lowest scores, the code offers a comprehensive summary of the score distribution, allowing for a better understanding of the dataset's characteristics.
The output will be:
Percentile Scores:
0th percentile: 67.0
10th percentile: 70.1
20th percentile: 76.8
30th percentile: 78.0
40th percentile: 83.2
50th percentile: 84.5
60th percentile: 85.0
70th percentile: 90.2
80th percentile: 93.2
90th percentile: 97.0
100th percentile: 100.0

The highest score is: 100
The lowest score is: 67
As you can see, the minimum value is 67 and the maximum value is 100 and this is evidenced by the outputs at the 0th and 100th percentiles, respectively, as well as the results of the np.min() and np.max() functions.
The key takeaway from this example is that the second argument to np.percentile() need not be a single number (denoting the percentile) but can be an array of values.
What are the arguments of numpy.percentile()?
At this point, it is good to look exhaustively at the numpy.percentile() function and all the arguments it can take as input. Here is the signature of the function:
numpy.percentile(a, q, axis=None, out=None,overwrite_input=False,
              method=’linear’, keepdims=False, interpolation=None)
In the above format, the arguments denote:
a: The input array or object that can be converted to an array.
q: The percentile(s) to compute, specified as a value between 0 and 100 inclusive, or a sequence of percentiles.
axis (optional): The axis along which the percentiles are computed. If None (default), the percentile is computed over the flattened array.
out (optional): An alternative output array to store the result.
overwrite_input (optional): If True, the input array can be modified and used as the output array to save memory.
method (optional): The interpolation method used when the desired percentile lies between two data points ('linear', 'lower', 'higher', 'midpoint', 'nearest'). Default is 'linear'.
keepdims (optional): If True, the reduced axes are left in the result as dimensions with size one.
interpolation (optional): Deprecated name for the method argument.
Example 4: Finding percentiles in multi-dimensional arrays
When working with 2D arrays, numpy.percentile() calculates percentiles along a specified axis, which can be either the row direction or the column direction. The function treats each row or column as a separate vector and computes the percentiles independently for each vector.
Consider the below program:
import numpy as np

arr = np.array([[10, 20, 30],
                [40, 50, 60],
                [70, 80, 90],
                [100,110,120]])

# Calculate the 50th percentile (median)
my_percentiles = np.percentile(arr, 50, axis=0)
print(my_percentiles)
This program will output:
[55. 65. 75.]How does that work? Essentially we treat each row as a vector. And we wish to find a median vector (percentile=50) so that two of the vectors will lie to the “left” of it and two of the given vectors will lie to the “right” of it. You can see that, elementwise, if we consider each dimension (first 55, then 65, then 75), the corresponding values in the original arrays neatly partition into two on the left (less than) and two on the right (greater than).
Similarly, if we do:
import numpy as np

arr = np.array([[10, 20, 30],
                [40, 50, 60],
                [70, 80, 90],
                [100,110,120]])

# Calculate the 50th percentile (median)
my_percentiles = np.percentile(arr, 50, axis=1)
print(my_percentiles)
we get:
[ 20. 50. 80. 110.]Note that the output now has four dimensions because we are now viewing vectors along the vertical dimension (and which thus have 4 components).Further, [ 20. 50. 80. 110.] is really the median vector viewed like this (it is in fact the second column in the original array). One vector is to the “left” of it and one vector is to the “right” of it.
This flexibility in choosing the axis allows you to analyze the distribution of values in a 2D array from different perspectives, providing insights into the data along rows or columns as needed.
If you liked this blogpost checkout other numpy content on the Kodeclik blog such as the numpy.equal() and numpy.any() functions.
Want to learn Python with us? Sign up for 1:1 or small group classes.
