Kodeclik Blog
Pandas crosstab()
Recall that a Pandas dataframe is just like a table or spreadsheet, composed of columns and rows which contain data about some subject matter. Each column denotes typically one attribute (or variable) and each row contains one instance or observation of all variables.
Sometimes we are given “non-dataframe” data, i.e., data that is not in dataframe format and we wish to capture summary statistics from this data in the form of a dataframe. This is what the Pandas crosstab() function is for!
Consider for instance:
import pandas as pd

products = ["Apples","Bananas","Shampoo","Chips","Salsa"]
months = ["Jan", "Feb", "Mar", "Mar", "Apr"]
quantities = [5,10,2,3,2]
Here we are given three lists: products, months, and quantities. Different products are sold in different months in different quantities and this information is recorded in the above lists. Thus, we can see that 5 apples were sold in January, 2 (units of) Shampoo were sold in March, and so on. Note that there are two items sold in March: Shampoo and Chips. We wish to create summaries of sales across months, across products, and across both months and products. That is what pandas crosstab() is for!
Here is the most basic use of crosstab():
import pandas as pd

products = ["Apples","Bananas","Shampoo","Chips","Salsa"]
months = ["Jan", "Feb", "Mar", "Mar", "Apr"]
quantities = [5,10,2,3,2]

print(pd.crosstab(products, months))
The output is:
col_0    Apr  Feb  Jan  Mar
row_0
Apples     0    0    1    0
Bananas    0    1    0    0
Chips      0    0    0    1
Salsa      1    0    0    0
Shampoo    0    0    0    1
Note that the crosstab() function above is given only two inputs, namely the products and months (it doesn’t take quantities as input). The output is simply counting the frequencies of each (product, month) pair and outputting these frequencies. As you can see every row has only one “1”. Every column has only one “1” except for March which has two products sold in that month. Also note that the products and months are sorted.
If you flip the order in which you gave these inputs:
import pandas as pd

products = ["Apples","Bananas","Shampoo","Chips","Salsa"]
months = ["Jan", "Feb", "Mar", "Mar", "Apr"]
quantities = [5,10,2,3,2]

print(pd.crosstab(months, products))
The output is:
col_0  Apples  Bananas  Chips  Salsa  Shampoo
row_0
Apr         0        0      0      1        0
Feb         0        1      0      0        0
Jan         1        0      0      0        0
Mar         0        0      1      0        1
Thus the rows have become columns and the columns have become rows.
In the above two examples, notice that pandas does not have a good idea of what to name the columns and rows so it has simply called them “col_0” and “row_0”. We can specify names in the following manner:
import pandas as pd

products = ["Apples","Bananas","Shampoo","Chips","Salsa"]
months = ["Jan", "Feb", "Mar", "Mar", "Apr"]
quantities = [5,10,2,3,2]

print(pd.crosstab(products, months,
      rownames=['Groceries'],colnames=['Months']))
The output is:
Months     Apr  Feb  Jan  Mar
Groceries
Apples       0    0    1    0
Bananas      0    1    0    0
Chips        0    0    0    1
Salsa        1    0    0    0
Shampoo      0    0    0    1
Finally, we can specify that the table must contain not just frequencies but also quantities but you must also specify how these quantities should be aggregated (by default we usually intend for these quantities to be summed up, so the aggregation function is just “sum”):
import pandas as pd

products = ["Apples","Bananas","Shampoo","Chips","Salsa"]
months = ["Jan", "Feb", "Mar", "Mar", "Apr"]
quantities = [5,10,2,3,2]

print(pd.crosstab(products, months, quantities,
      rownames=['Groceries'],colnames=['Months'],
      aggfunc=sum))
The output is:
Months     Apr   Feb  Jan  Mar
Groceries
Apples     NaN   NaN  5.0  NaN
Bananas    NaN  10.0  NaN  NaN
Chips      NaN   NaN  NaN  3.0
Salsa      2.0   NaN  NaN  NaN
Shampoo    NaN   NaN  NaN  2.0
Note that most cells have “NaN” (not a number) because we had no data for those (product, month) combinations. For others we have added up the values to product the final table.
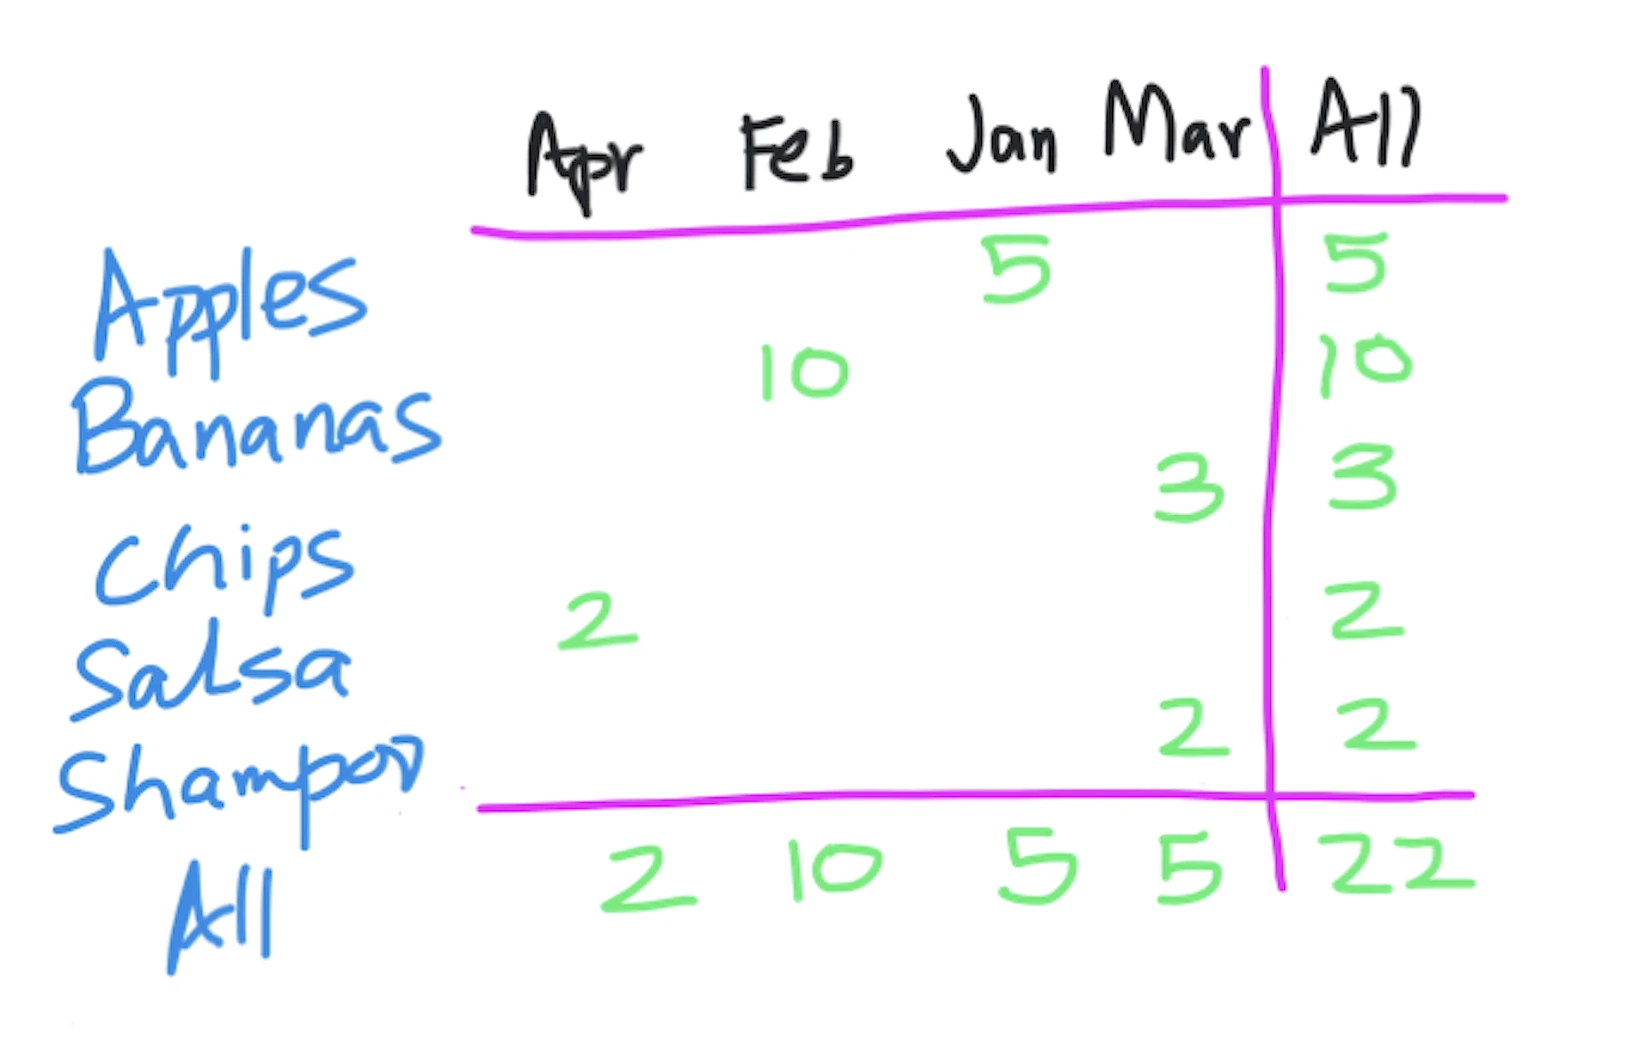
A last feature of pandas crosstab() is that we can extract row marginals, column marginals, and marginals across the whole table. We simply add “margins=True” to our crosstab invocation:
import pandas as pd

products = ["Apples","Bananas","Shampoo","Chips","Salsa"]
months = ["Jan", "Feb", "Mar", "Mar", "Apr"]
quantities = [5,10,2,3,2]

print(pd.crosstab(products, months, quantities,
      rownames=['Groceries'],colnames=['Months'],
      aggfunc=sum,margins=True))
The output is:
Months     Apr   Feb  Jan  Mar  All
Groceries
Apples     NaN   NaN  5.0  NaN    5
Bananas    NaN  10.0  NaN  NaN   10
Chips      NaN   NaN  NaN  3.0    3
Salsa      2.0   NaN  NaN  NaN    2
Shampoo    NaN   NaN  NaN  2.0    2
All        2.0  10.0  5.0  5.0   22
Note that there is now an “All” column (denoting all months), an “All” row (denoting all products). Each value here is simply an aggregation along a particular row or column. Further, note that there is an aggregation across both rows and columns, which yields 22.
If you liked this blogpost, checkout our blogpost on Pandas daterange. Also learn how to reorder columns in a Pandas dataframe.
Interested in more things Python? Checkout our post on Python queues. Also see our blogpost on Python's enumerate() capability. Also if you like Python+math content, see our blogpost on Magic Squares. Finally, master the Python print function!
Want to learn Python with us? Sign up for 1:1 or small group classes.
