Kodeclik Blog
Data clipping with numpy.clip()
Data clipping is a fundamental aspect of data analysis that involves setting a maximum and minimum range for data values. This technique is useful in several applications, such as image processing, signal processing, and data visualization, to remove outliers and preserve data integrity.
numpy.clip() is a versatile function in the numpy library that provides a simple and efficient way to clip data values to a specified range. The function takes three arguments. The first is the array to be clipped and the second and third specify the minimum and maximum values of the clipping range. This function returns a new array with the same shape as the input array 'a', but with values outside the specified range clipped to the minimum or maximum values.
Let us try it out!
import numpy as np

temperatures = [85.6, 75.4, 81.3, 75.4, 81.3]

print(temperatures)
print(np.clip(temperatures,78,82))
In the above program we first create a list of temperatures and print them. Then we clip these temperatures so that the minimum value is 78 and the maximum value is 82. This means values less than 78 (e.g., 75.4) will get clipped to 78 and values more than 82 (e.g., 85.6) will get clipped to 82. The output is thus:
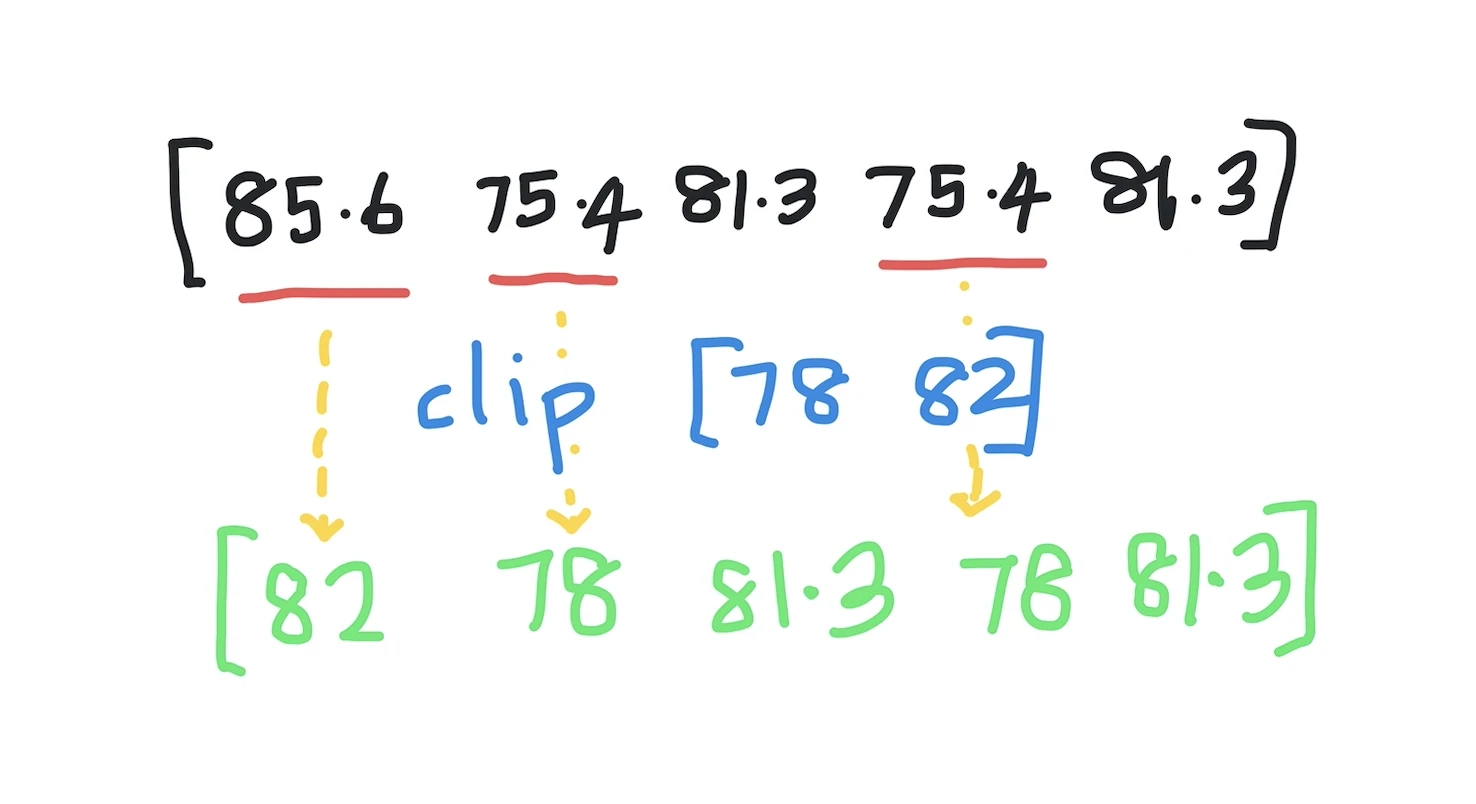
[85.6, 75.4, 81.3, 75.4, 81.3]
[82.  78.  81.3 78.  81.3]
as expected. Note that the number of elements stays the same. Clipping does not remove elements, only modify some values to corresponding minimum or maximum values.
numpy.clip() does not perform any check to ensure that the second argument (denoting the minimum value) is less than the third argument (denoting the maximum value). When the second argument is greater than the third, clip returns an array in which all values are equal to the third, like so:
import numpy as np

temperatures = [85.6, 75.4, 81.3, 75.4, 81.3]

print(temperatures)
print(np.clip(temperatures,82,78))
The output is:
[85.6, 75.4, 81.3, 75.4, 81.3]
[78. 78. 78. 78. 78.]
Uses of numpy.clip()
There are many areas where we can use numpy.clip(). First, numpy.clip() can be used to remove outliers from a dataset by setting a maximum and minimum threshold for data values. This technique is useful in data preprocessing to remove extreme values that can skew statistical analysis.
Second, numpy.clip() is widely used in image processing to clip pixel values to a specific range, such as 0 to 255 for grayscale images or 0 to 1 for normalized images. This helps to enhance image contrast and reduce noise.
Finally, numpy.clip() can be used in data visualization to set a range for data values displayed on a plot. This helps to highlight patterns and trends in the data and avoid distortion due to extreme values.
In this blogpost, we have explored the numpy.clip() function and its applications in data analysis. We have seen how numpy.clip() provides a simple and efficient way to clip data values to a specified range, making it a valuable tool in data preprocessing, image processing, and data visualization. By mastering numpy.clip(), you can enhance your data analysis skills and produce accurate and insightful results.
If you liked this blogpost, learn how numpy.roll() works!
Interested in more things Python? Checkout our post on Python queues. Also see our blogpost on Python's enumerate() capability. Also if you like Python+math content, see our blogpost on Magic Squares. Finally, master the Python print function!
Want to learn Python with us? Sign up for 1:1 or small group classes.
