Kodeclik Blog
Numpy Linspace numpy.linspace() in Python
The Numpy Linspace numpy.linspace() function is a part of the Python numpy library that enables us to generate an array of evenly spaced elements between two specified, start and stop, values. It takes three parameters – start, stop and num (num is optional), where start and stop are the beginning and ending limits (lowest & highest) points respectively for the sequence; and num is the number of samples we want to generate between these two limits (including both).
Example 1: start and stop values with samples unspecified
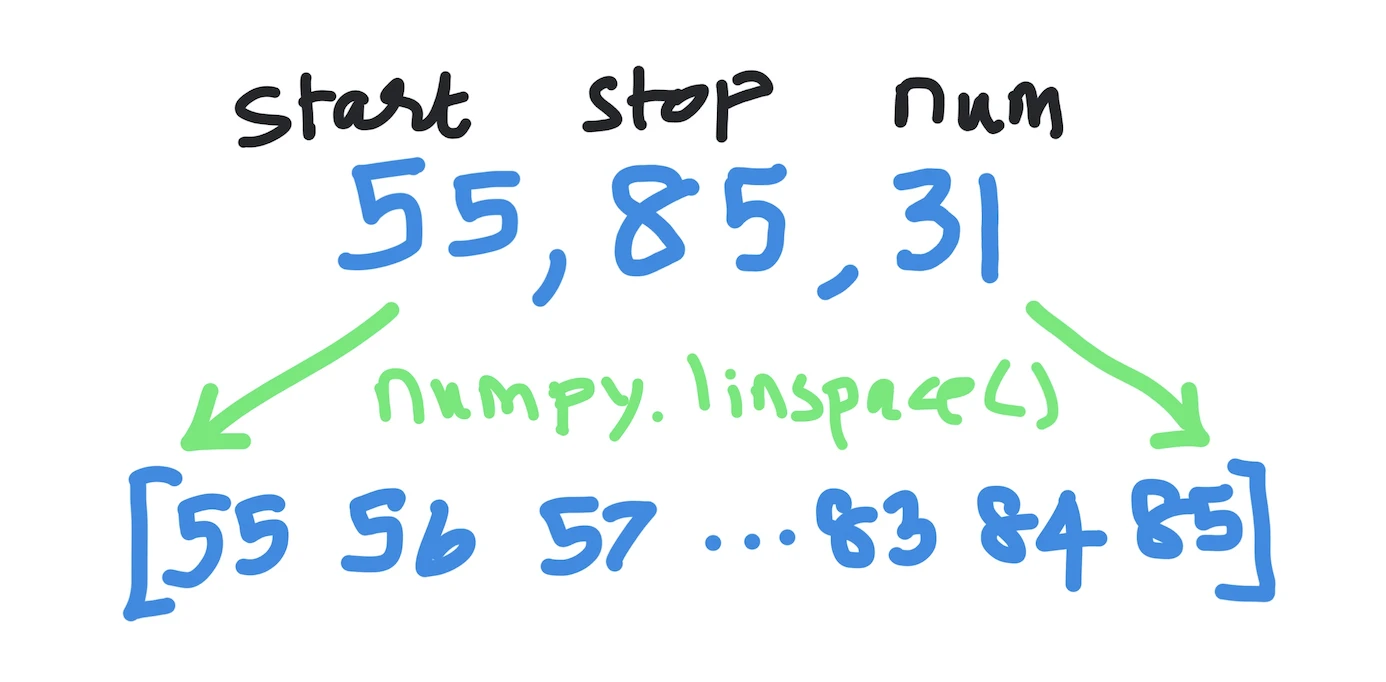
Let us assume we are exploring temperatures in a given location and they range from 55F to 85F. Let us assume we would like to generate temperatures within the range [55,85]. Here is the simplest way to use numpy.linspace():
import numpy as np

start = 55
stop = 85

print(np.linspace(start,stop))
By default, when num is not specified (recall that it is optional), it is assumed to be 50. Thus, the above line generates 50 values from 55 to 85, inclusive:
[55.        55.6122449  56.2244898  56.83673469 57.44897959
58.06122449 58.67346939 59.28571429 59.89795918 60.51020408
61.12244898 61.73469388 62.34693878 62.95918367 63.57142857
64.18367347 64.79591837 65.40816327 66.02040816 66.63265306
67.24489796 67.85714286 68.46938776 69.08163265 69.69387755
70.30612245 70.91836735 71.53061224 72.14285714 72.75510204
73.36734694 73.97959184 74.59183673 75.20408163 75.81632653
76.42857143 77.04081633 77.65306122 78.26530612 78.87755102
79.48979592 80.10204082 80.71428571 81.32653061 81.93877551
82.55102041 83.16326531 83.7755102 84.3877551  85.        ]
Note that linspace() finds the stepsize automatically (i.e., this is not a parameter). All you need to supply is the number of values you need.
Example 2: start and stop values with number of samples given
For instance, because 85-55=30, we specify num=31 to make numpy.linspace() output integers from 55 to 85. Here is the program for doing so:
import numpy as np

start = 55
stop = 85

print(np.linspace(start,stop,num=31))
This generates:
[55. 56. 57. 58. 59. 60. 61. 62. 63. 64. 65. 66. 67. 68. 69.
70. 71. 72. 73. 74. 75. 76. 77. 78. 79. 80. 81. 82. 83. 84. 85.]
Indeed we get integer values but note that they are all output as floats.
Example 3: endpoint exclusion
You can also use endpoint=False which means to not include the “stop” value. Lets use that and also reduce the num from 31 to 30 (which should again make the generated values to be integral values):
import numpy as np

start = 55
stop = 85

print(np.linspace(start,stop,num=30,endpoint=False))
The output is:
[55. 56. 57. 58. 59. 60. 61. 62. 63. 64. 65. 66. 67. 68. 69.
70. 71. 72. 73. 74. 75. 76. 77. 78. 79. 80. 81. 82. 83. 84.]
Example 4: returning stepsize
One additional feature of linspace is, because we only specify the number of values we need and not the step size, we can ask it to return the stepsize for us (by specifying retstep=True, i.e., retstep refers to “return step”). Here is how that works:
import numpy as np

start = 55
stop = 85

print(np.linspace(start,stop,num=30,endpoint=False,retstep=True))
The output will be:
(array([55., 56., 57., 58., 59., 60., 61., 62., 63., 64., 65.,
66., 67., 68., 69., 70., 71., 72., 73., 74., 75., 76., 77., 78.,
79., 80., 81., 82., 83., 84.]), 1.0)
Note that we get a tuple of two components, so we can unpack it like so:
import numpy as np

start = 55
stop = 85

(values, stepsize) =
    np.linspace(start,stop,num=30,endpoint=False,retstep=True)

print(values)
print(stepsize)
The output will be:
[55. 56. 57. 58. 59. 60. 61. 62. 63. 64. 65. 66. 67. 68. 69.
70. 71. 72. 73. 74. 75. 76. 77. 78. 79. 80. 81. 82. 83. 84.]
1.0
Example 5: multidimensional arrays
A final feature in numpy.linspace() is that you can use it to generate multidimensional arrays of evenly spaced values:
import numpy as np

start = 55
stop = 85

print(np.linspace(start=[1, 2, 4], stop=[10, 20, 76], num=10))
In the above, we are essentially creating three series of values, from 1 to 10, from 2 to 20, and from 4 to 76. The output is as expected:
[[ 1.  2.  4.]
[ 2.  4. 12.]
[ 3.  6. 20.]
[ 4.  8. 28.]
[ 5. 10. 36.]
[ 6. 12. 44.]
[ 7. 14. 52.]
[ 8. 16. 60.]
[ 9. 18. 68.]
[10. 20. 76.]]
One of the main uses for numpy linspace() is plotting graph data points on a graph using matplotlib or other plotting libraries in Python. By using linspace(), you can quickly create an array with an even distribution of values that can be used as data points for plotting graphs or other visualizations.
Example 6: Plotting curves
Let us use these concepts to approximate a curve, for instance a sine curve. The numpy.linspace() function is useful for generating evenly spaced values for various applications, such as creating x-values for plot functions in data visualization libraries like Matplotlib.
Consider the following program:
import numpy as np
import matplotlib.pyplot as plt

# Generate evenly spaced values between 0 and 4*pi
x = np.linspace(0, 4 * np.pi, 10)

# Calculate the sine values for the evenly spaced x values
y = np.sin(x)

# Plot the sine curve
plt.plot(x, y)
plt.title('Sine Curve')
plt.xlabel('x')
plt.ylabel('sin(x)')
plt.show()
And its output will be:
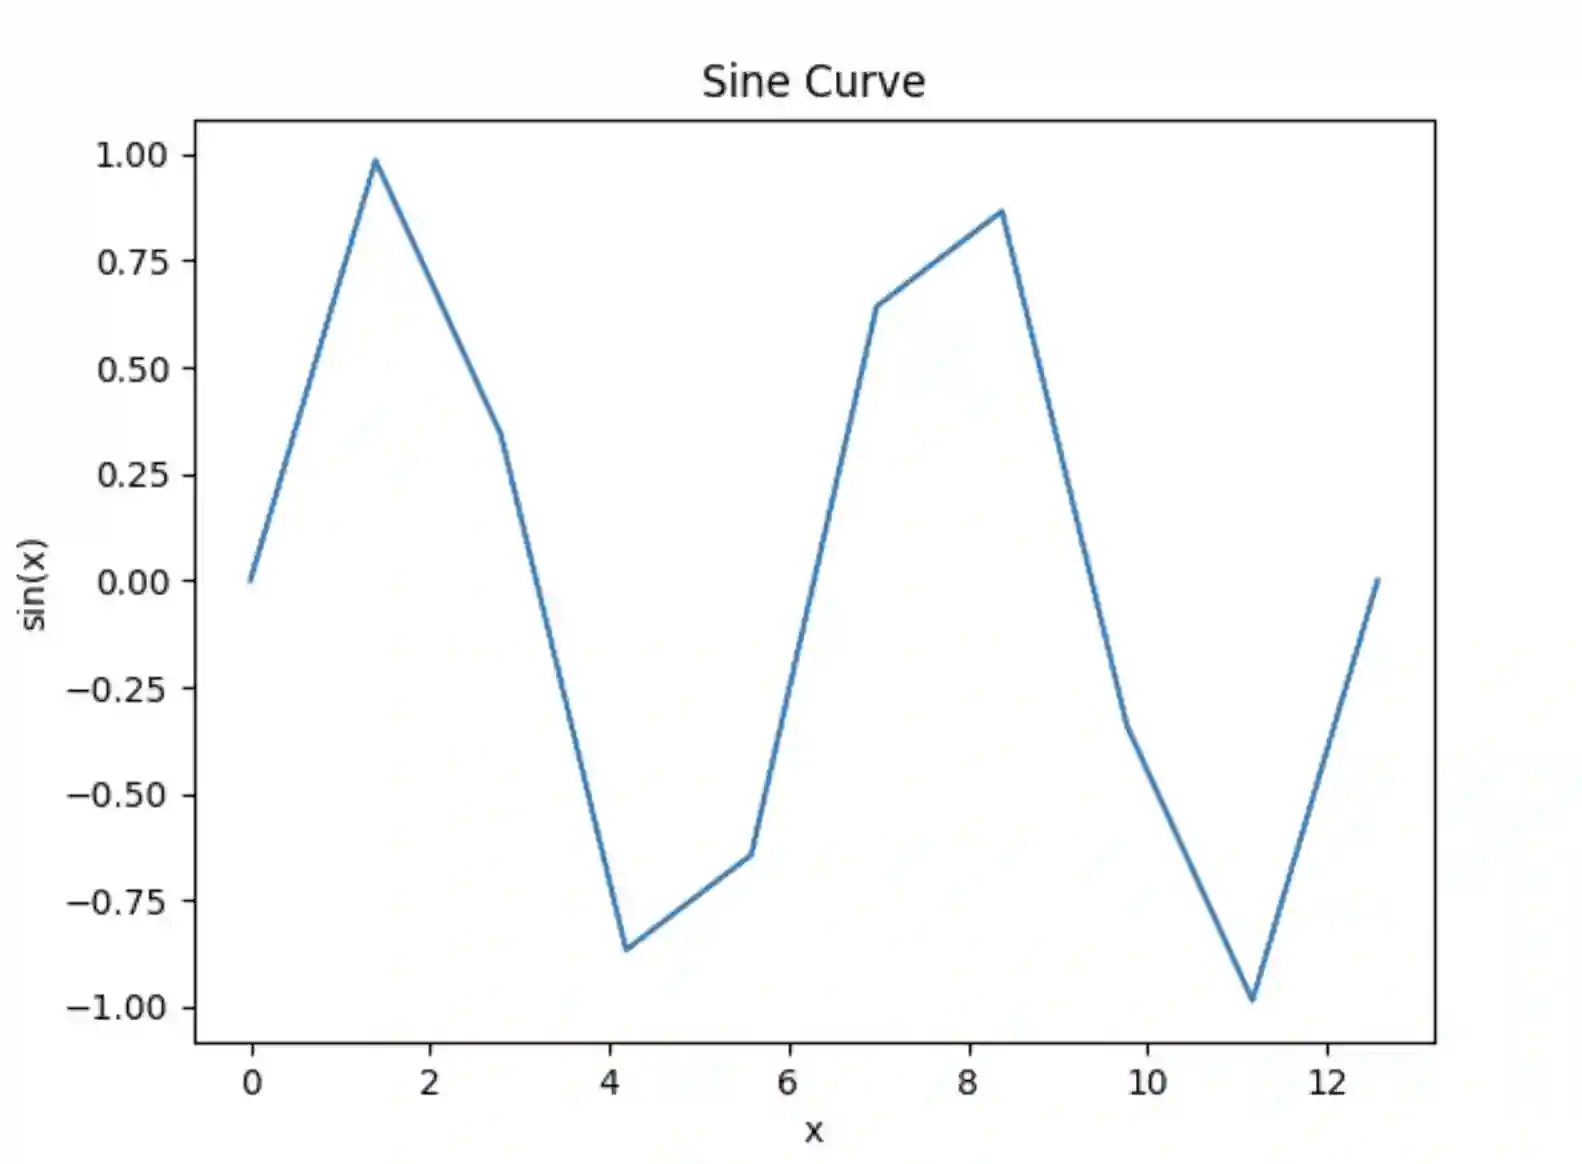
You will see that the plot is a bit chunky (more on that below).
To understand the above program, we first import the necessary libraries: numpy for numerical operations and matplotlib.pyplot for plotting.
We then use np.linspace(0, 4np.pi, 10) to generate 10 evenly spaced values between 0 and 4pi. These values will be used as the x-coordinates for plotting the sine curve. Next, we calculate the sine values for each of the evenly spaced x values using np.sin(x).
We use plt.plot(x, y) to plot the x and y values, which will create the sine curve. We add a title, x-axis label, and y-axis label to the plot using plt.title(), plt.xlabel(), and plt.ylabel(), respectively. Finally, we call plt.show() to display the plot.
The resulting plot will show an approximate sine curve with 100 evenly spaced points between 0 and 2*pi on the x-axis, and the corresponding sine values on the y-axis.
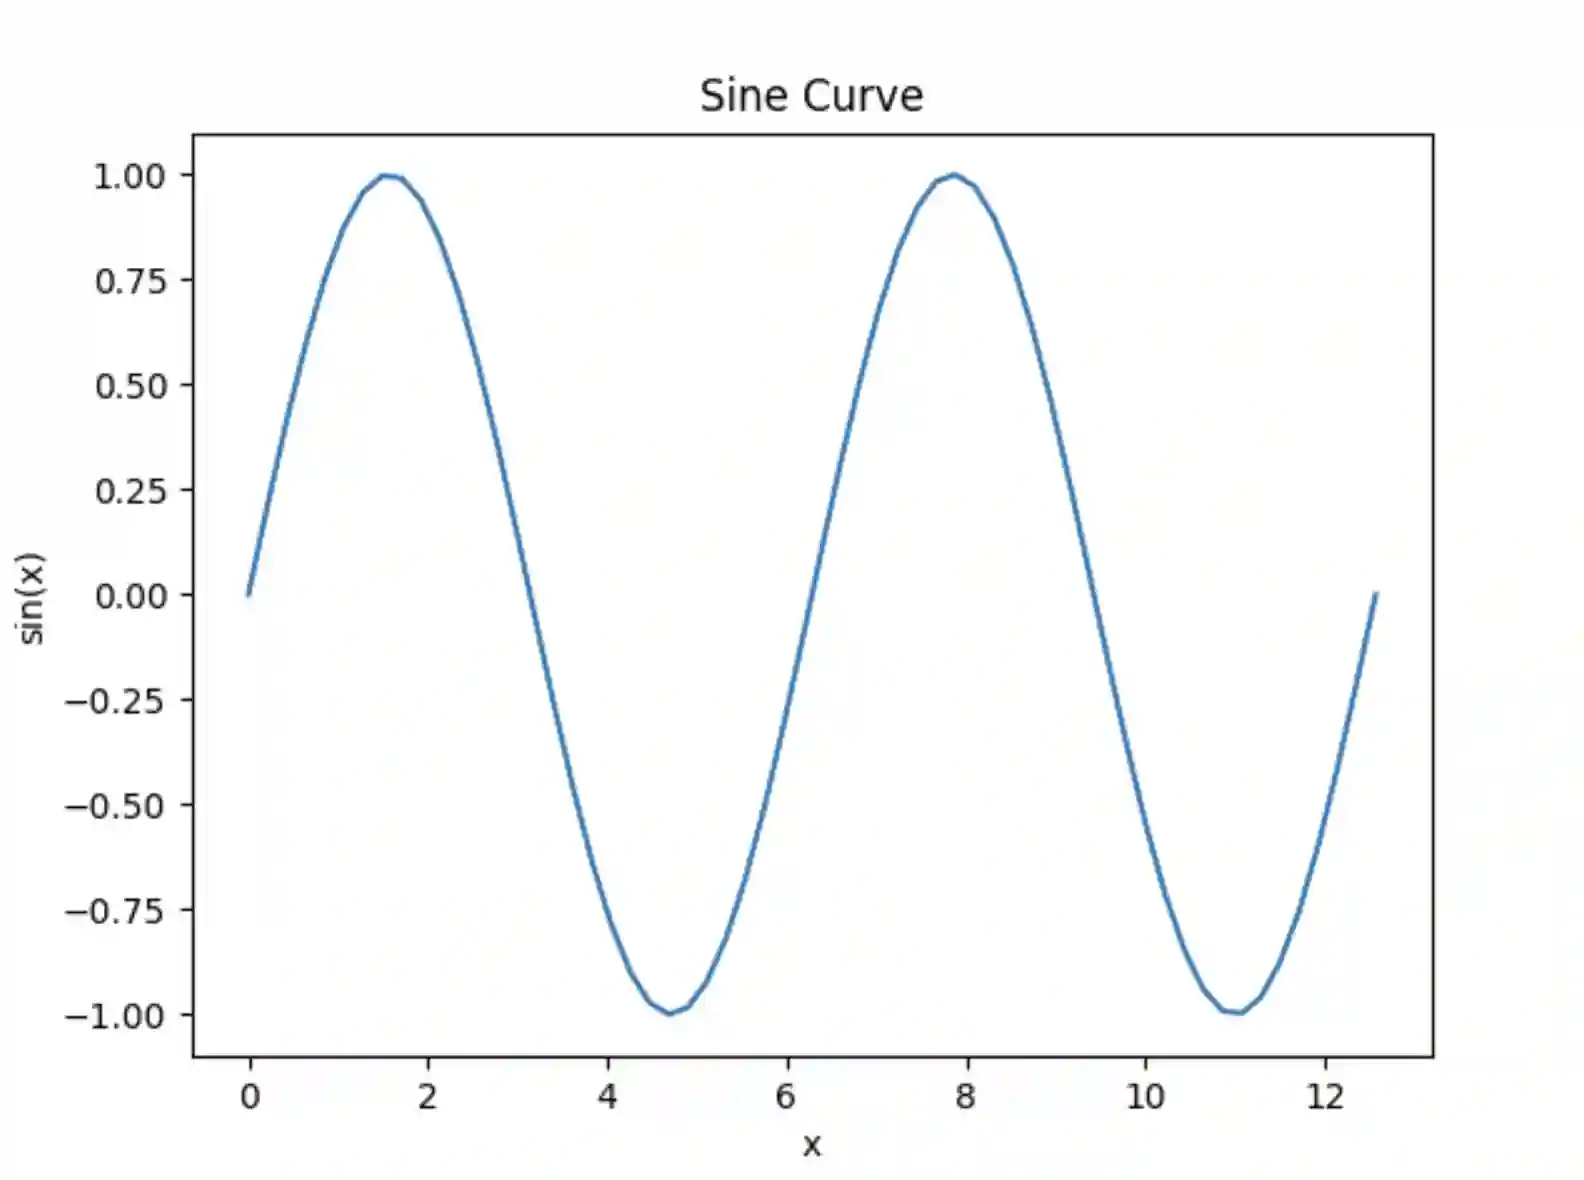
Now back to how the plot looks, it is looking chunky or jagged because there are not enough evenly spaced points being sampled to create a smooth sine curve. If we increase the number of points from 10 to say 60:
import numpy as np
import matplotlib.pyplot as plt

# Generate evenly spaced values between 0 and 4*pi
x = np.linspace(0, 4 * np.pi, 60)

# Calculate the sine values for the evenly spaced x values
y = np.sin(x)

# Plot the sine curve
plt.plot(x, y)
plt.title('Sine Curve')
plt.xlabel('x')
plt.ylabel('sin(x)')
plt.show()
Note that we have changed only one line - from 10 points to 60 points. The output will be:
Example 7: Plotting a grid of points
Let us use numpy.linspace() to plot a grid of evenly spaced points. Consider the below program:
import numpy as np
import matplotlib.pyplot as plt
# Generate evenly spaced x and y values
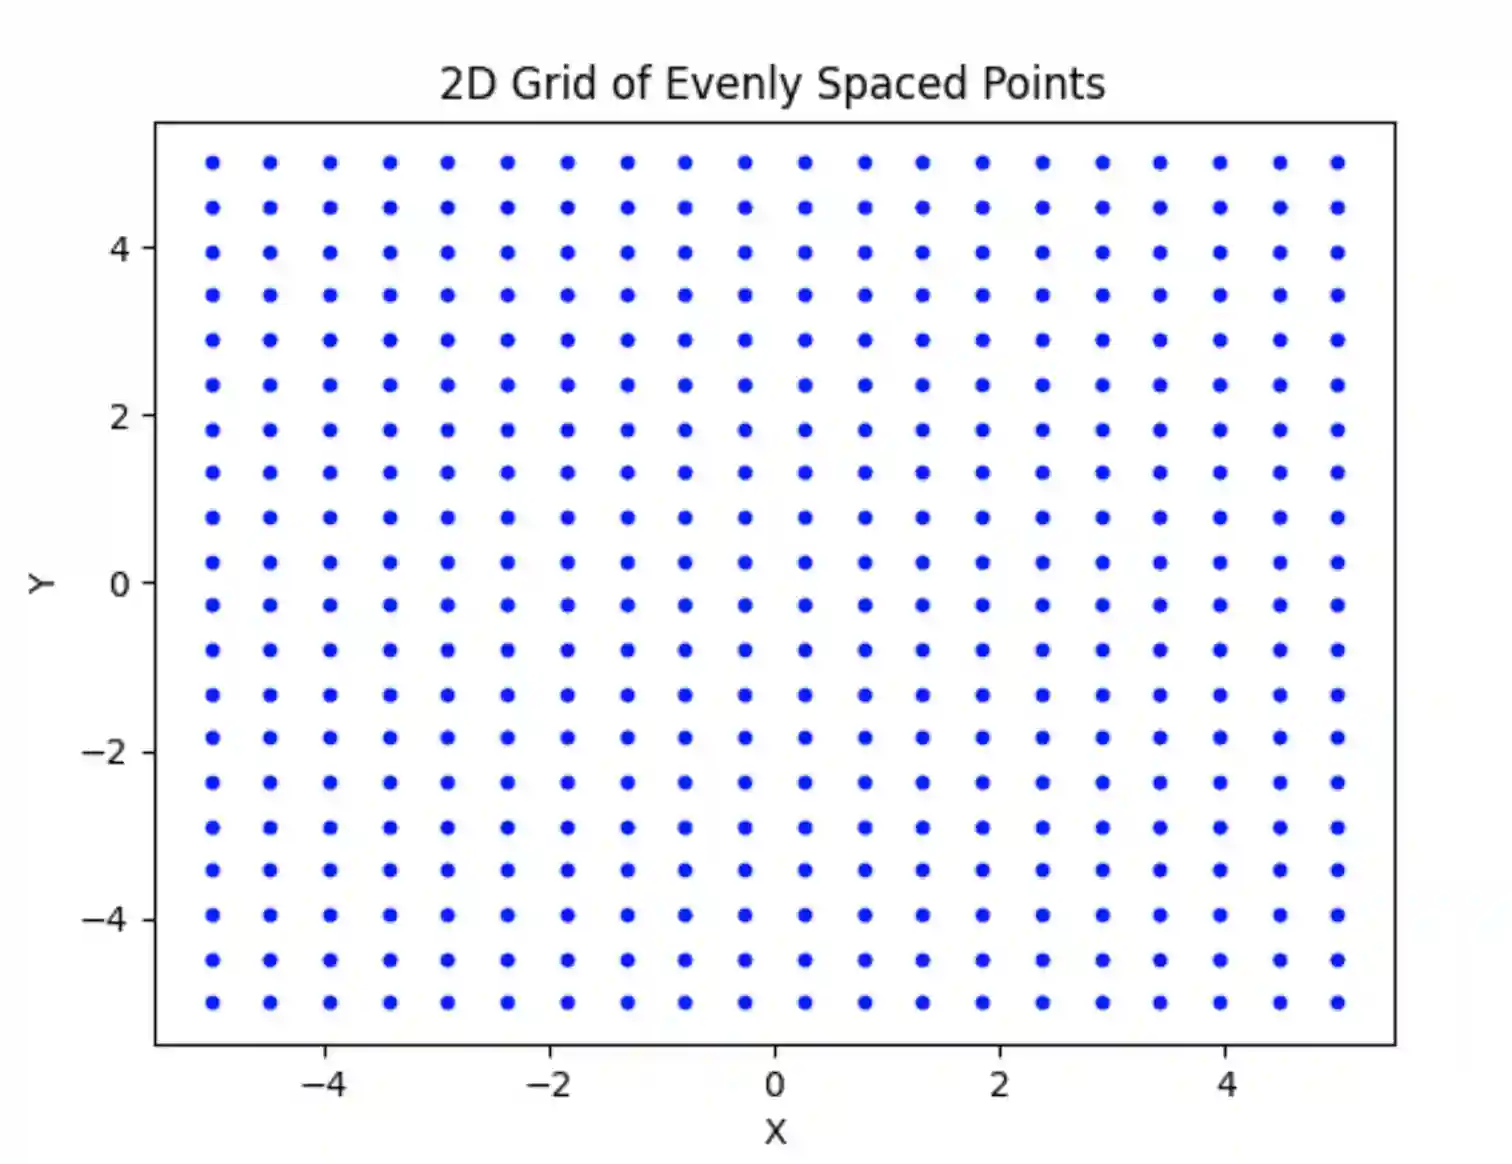
x = np.linspace(-5, 5, 20)
y = np.linspace(-5, 5, 20)
# Create a meshgrid from the x and y values
X, Y = np.meshgrid(x, y)
# Plot the grid of points
plt.scatter(X, Y, s=10, c='b', marker='o')
plt.title('2D Grid of Evenly Spaced Points')
plt.xlabel('X')
plt.ylabel('Y')
plt.show()To understand the program above, again we first import the necessary libraries: numpy for numerical operations and matplotlib.pyplot for plotting.
We then use np.linspace(-5, 5, 20) to generate 20 evenly spaced values between -5 and 5 for both x and y coordinates. Next, we use np.meshgrid(x, y) to create a meshgrid from the x and y values, which will give us the coordinates for a 2D grid of points.
We use plt.scatter(X, Y, s=10, c='b', marker='o') to plot the grid of points, where X and Y are the meshgrid coordinates, s=10 sets the size of the markers, c='b' sets the color to blue, and marker='o' sets the marker style to circles. We add a title, x-axis label, and y-axis label to the plot using plt.title(), plt.xlabel(), and plt.ylabel(), respectively. Finally, we call plt.show() to display the plot.
The resulting plot will show a 2D grid of 20x20 evenly spaced points between -5 and 5 on both the x and y axes, with blue circular markers:
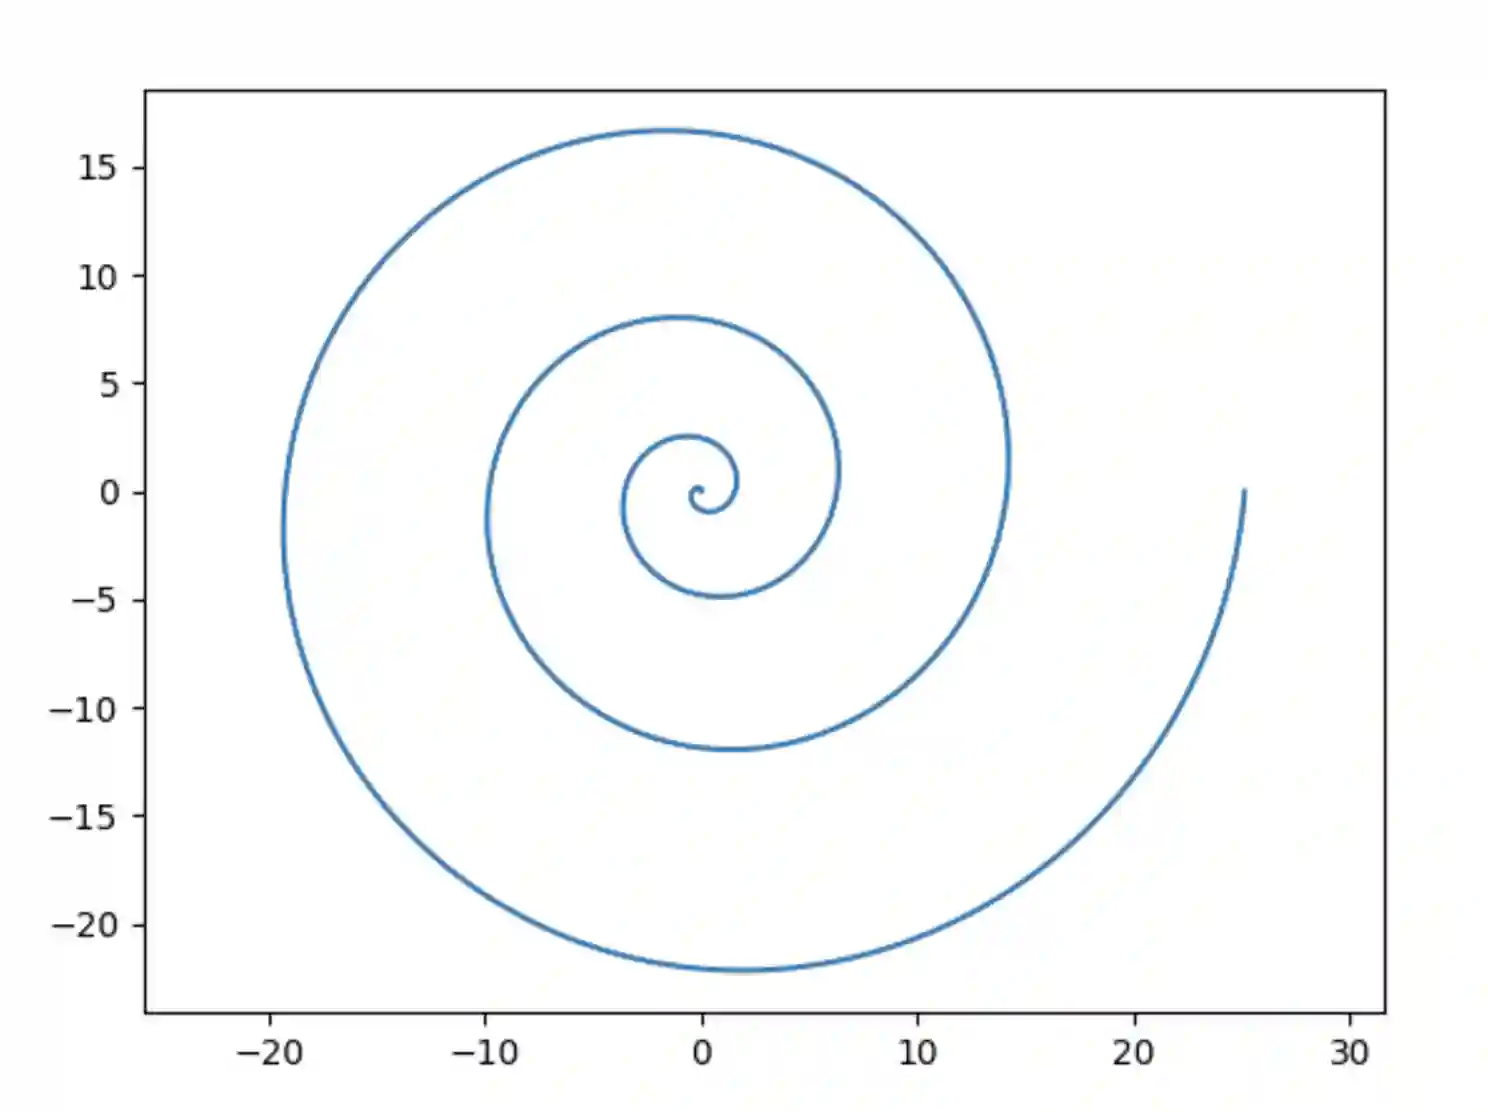
Example 8: Plotting a 2D spiral
Next, we use np.linspace() to generate 1000 evenly spaced values between 0 and 8π for the angle theta. We then use it in a program to draw a spiral:
import numpy as np
import matplotlib.pyplot as plt

theta = np.linspace(0, 8*np.pi, 1000)
r = theta**2 / (8*np.pi)

x = r * np.cos(theta)
y = r * np.sin(theta)

plt.plot(x, y)
plt.axis('equal')
plt.show()
Note that the program uses the radius r as a function of theta to create a spiral pattern. The x and y coordinates are calculated from r and theta, and then plotted to create a spiral curve. The output will be:
Numpy linspace arguments
Finally, to summarize, below is the list of all numpy.linspace() arguments, along with their descriptions and whether they are required or optional:
1. start (required): The starting value of the sequence.
2. stop (required): The end value of the sequence, unless endpoint is set to False. In that case, the sequence consists of all but the last of num + 1 evenly spaced samples, so that stop is excluded.
3. num (optional): Number of samples to generate. Default is 50. Must be non-negative.
4. endpoint (optional): If True, stop is the last sample. Otherwise, it is not included. Default is True.
5. retstep (optional): If True, return (samples, step), where step is the spacing between values. Default is False.
6. dtype (optional): The data type of the output array. If not given, the data type will be inferred from start and stop.
7. axis (optional): If start and stop are arrays, this specifies the axis along which the sequence will be generated. If 0, the sequence is added at the beginning, if -1, it's added at the end. Default is 0.
The start and stop arguments are required and represent the beginning and end of the interval over which the evenly spaced values will be generated.
The num argument is optional and specifies the number of values to generate. If not provided, the default value of 50 is used.
The endpoint argument is optional and determines whether the stop value is included in the generated sequence or not. By default, it is set to True, meaning the stop value is included.
The retstep argument is optional and, if set to True, returns a tuple containing the generated array and the step size between consecutive values.
The dtype argument is optional and specifies the data type of the output array. If not provided, the data type is inferred from the start and stop values.
The axis argument is optional and is used when start and stop are arrays, specifying the axis along which the sequence should be generated.
Summary
In closing, If you're looking for a quick and easy way to generate an array containing evenly spaced numbers within a given interval, then using numpy's linspace() function is ideal! This is useful whether you wish to generate data or use the data for plotting pretty pictures!
The main takeaway from this blogpost is that numpy.linspace() takes 3 parameters: start & stop which are used as lower & upper bounds respectively; the upper bound can be inclusive or exclusive; and num which specifies how many elements should be generated within those limits (defaulted at 50). Knowing how this function works can certainly come in handy when working with data visualizations or statistical pattern finding! So give it a try today!
If you liked this blogpost, checkout how to scale and rotate a vector in Python.
If you liked this blogpost, checkout our blogpost on comparing two dictionaries. Also learn how to unpack a dictionary into variables.
For more Python content, checkout the math.ceil() and math.floor() functions! Also
learn about the math domain error in Python and how to fix it!
Interested in more things Python? Checkout our post on Python queues. Also see our blogpost on Python's enumerate() capability. Also if you like Python+math content, see our blogpost on Magic Squares. Finally, master the Python print function!
Want to learn Python with us? Sign up for 1:1 or small group classes.
