Kodeclik Blog
Polar Coordinates in Desmos
Polar coordinates are just another way to describe locations.
For instance, how do you describe the location to a coffee shop from a given location? You say “go 3 blocks north, then 4 blocks east”. Assuming your current location is mapped to the origin, this will look like the following:
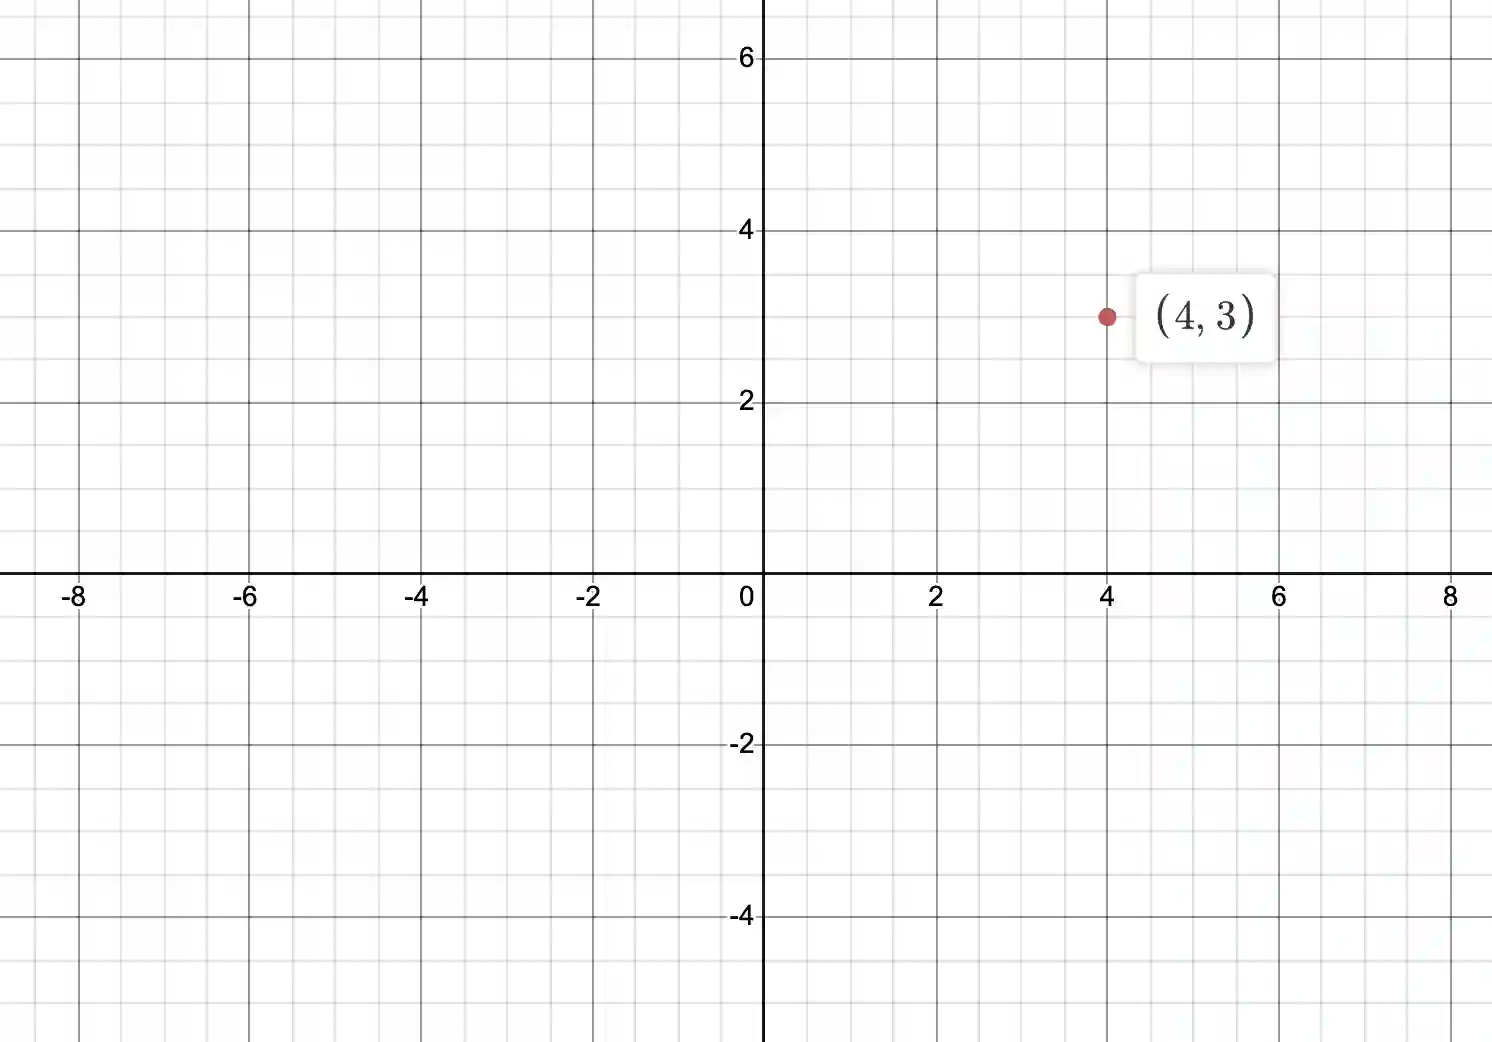
As you can see, the point with (x,y) = (4,3) is plotted on the map. The first value is the x-coordinate (i.e., the value in the east/west direction) and the second value is the y-coordinate (i.e., the value in the north/south direction).
This is called the cartesian coordinate system. This is how we describe locations in real life, so it comes naturally.
The polar coordinate system is a different way to describe the same location. Here is how that works. Instead of saying the distance to travel north/south vs east/west, you say something like the following: “go a distance of 5 to the right and rotate 36.87 degrees counter-clockwise around the x-axis”. You will get to the same location!
Instead of specifying x and y values, polar coordinates specify a radius and an angle (to rotate around the x-axis).
Thus, polar coordinates represent points as (radius, angle) pairs instead of (x-coordinate, y-coordinate) pairs.
To understand this, you can use Desmos to change the frame of reference from the default cartesian coordinate system to a polar coordinate system. Click the wrench icon in the upper right hand corner, and the choose the polar coordinate system. The figure will now look like:
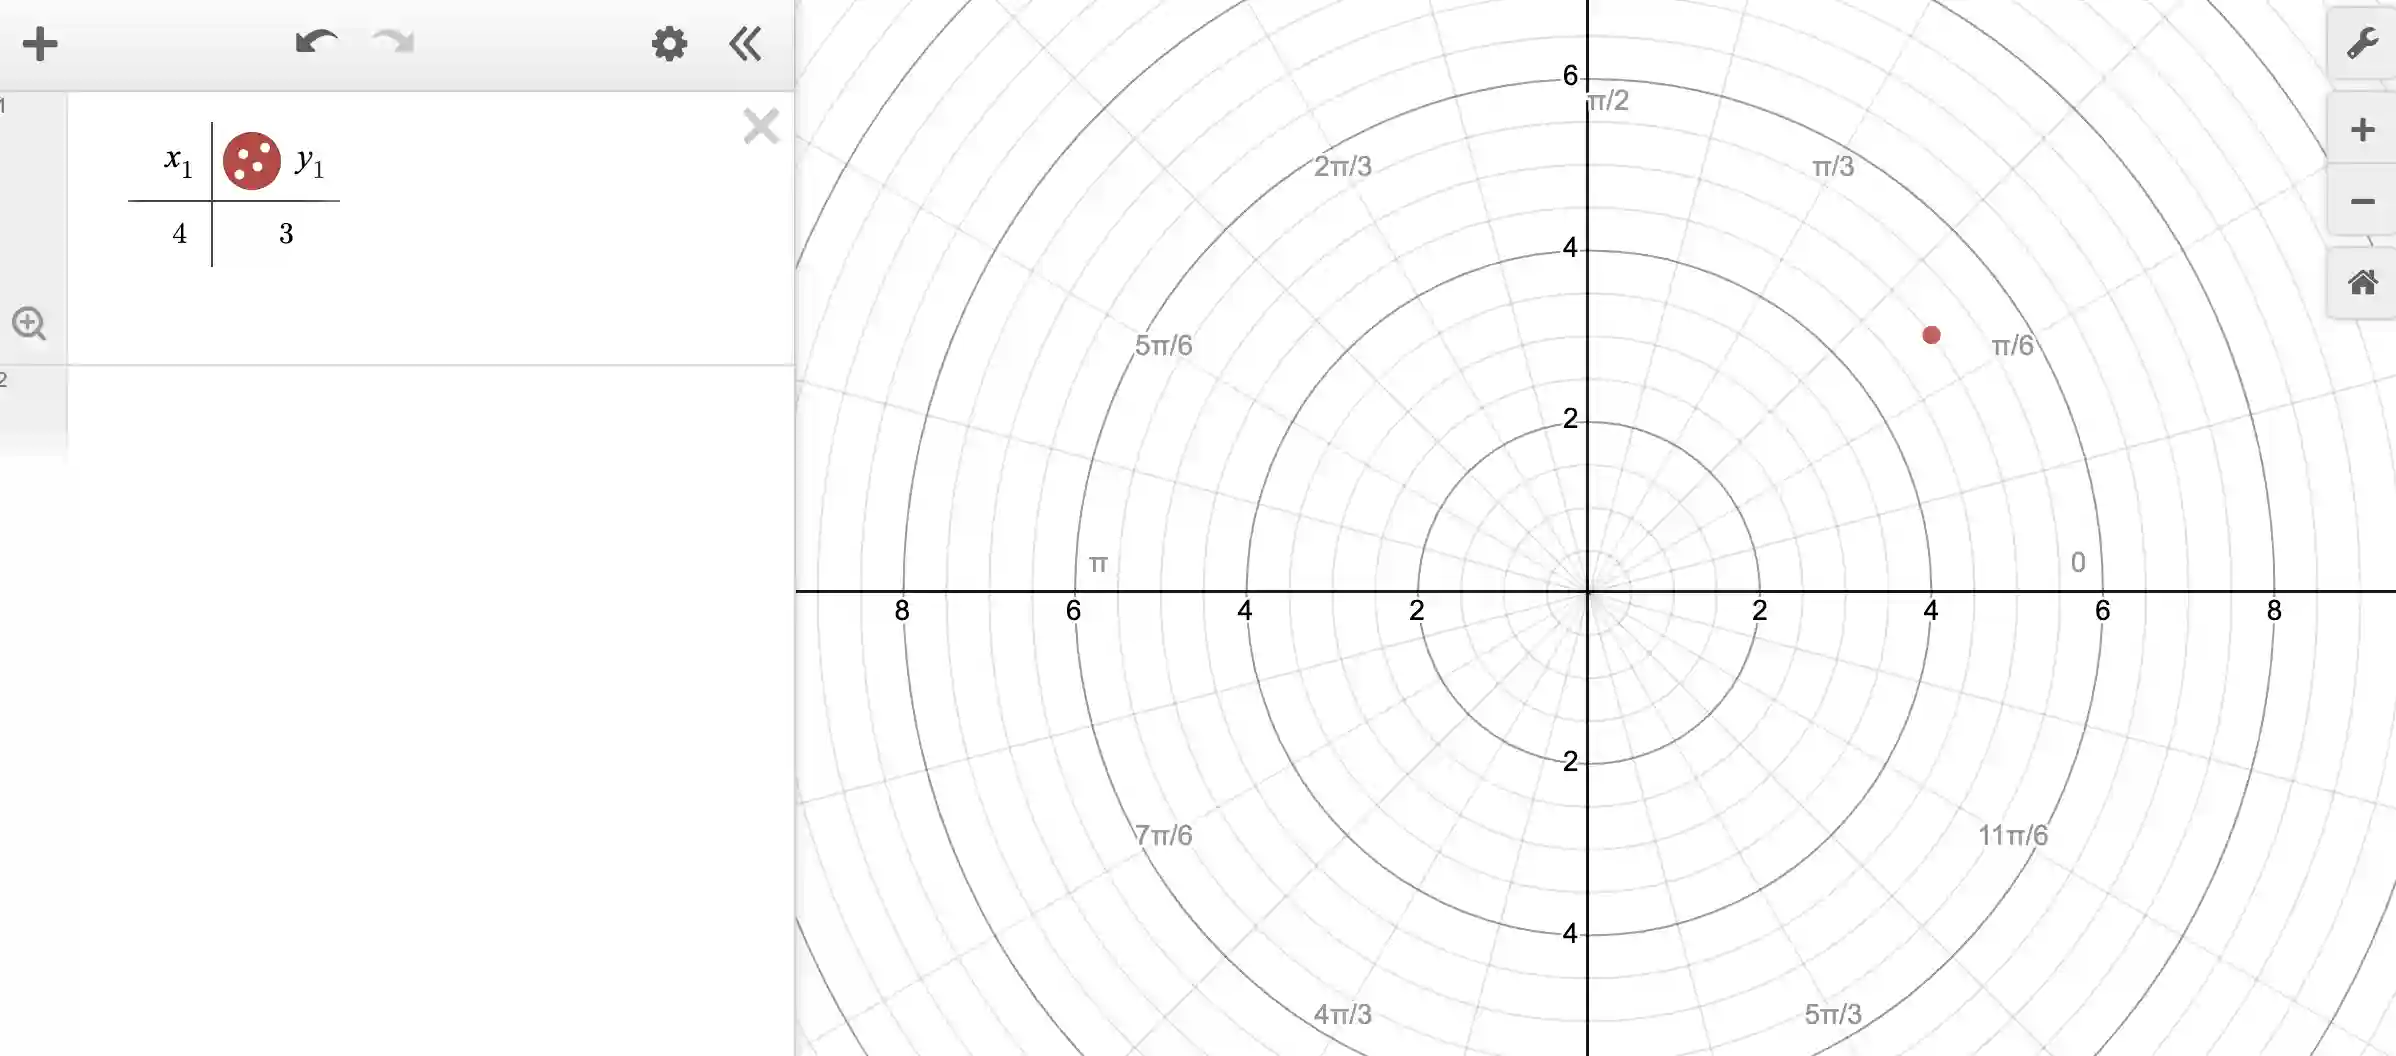
Note that the grid is laid out not in terms of rectangles but in terms of concentric circles around the origin. The values marked as the different radii. The angles are marked in terms of radians (so that the positive x-axis starts at 0, and then slowly increases counterclockwise to reach 12*pi/6, or 2*pi).
The same point as before continues to be plotted and you can now clearly see that it lies on a radius of 5, and it is at an angle of between pi/6 and pi/4, which earlier we described as 36.87 degrees.
Thus, the polar coordinate system is simply a different way to arrive at the same point unambiguously.
Polar coordinates are thus a way to describe where a point is located by using a distance and an angle. Instead of using x and y coordinates like in the usual coordinate system, we use "r" and "theta” in polar coordinates. The "r" tells us how far the point is from the center, and the "theta" tells us the angle the line makes with the positive x-axis. So, if you want to tell someone where a point is located, you can use polar coordinates to describe its distance and the angle it makes with the positive x-axis.
This sounds like a lot of trouble! Why should we use polar coordinates, or when should we use polar coordinates?
Drawing a circle in Desmos using polar coordinates
Polar coordinates are very useful when the concept you are thinking of is naturally described in terms of radii and angles rather than perpendicular x and y directions.
For instance, suppose we wish to draw a circle centered at the origin and radius of 5. We can do this in cartesian coordinates as:
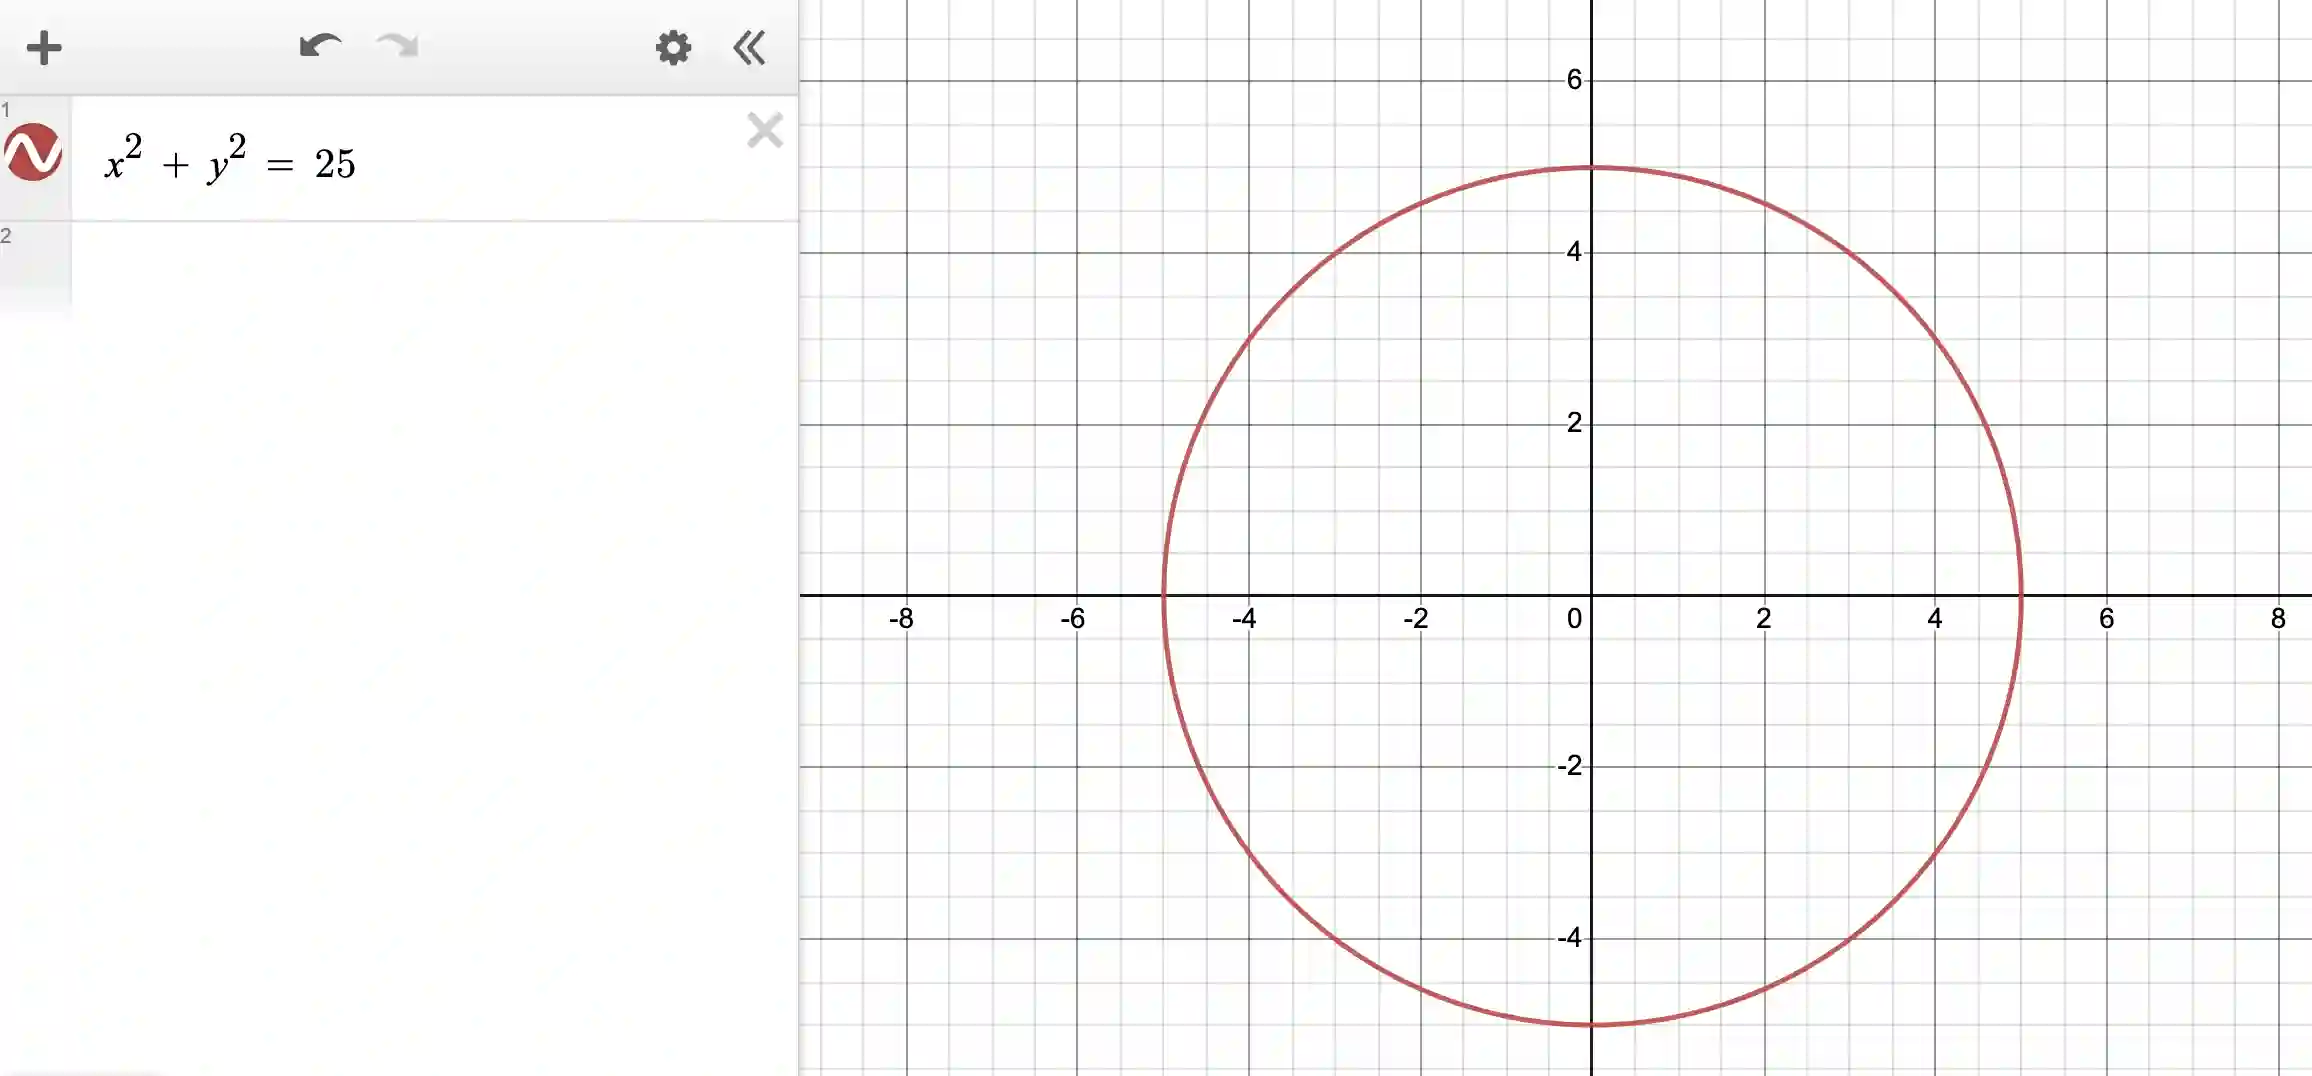
In polar coordinates, this is even simpler:
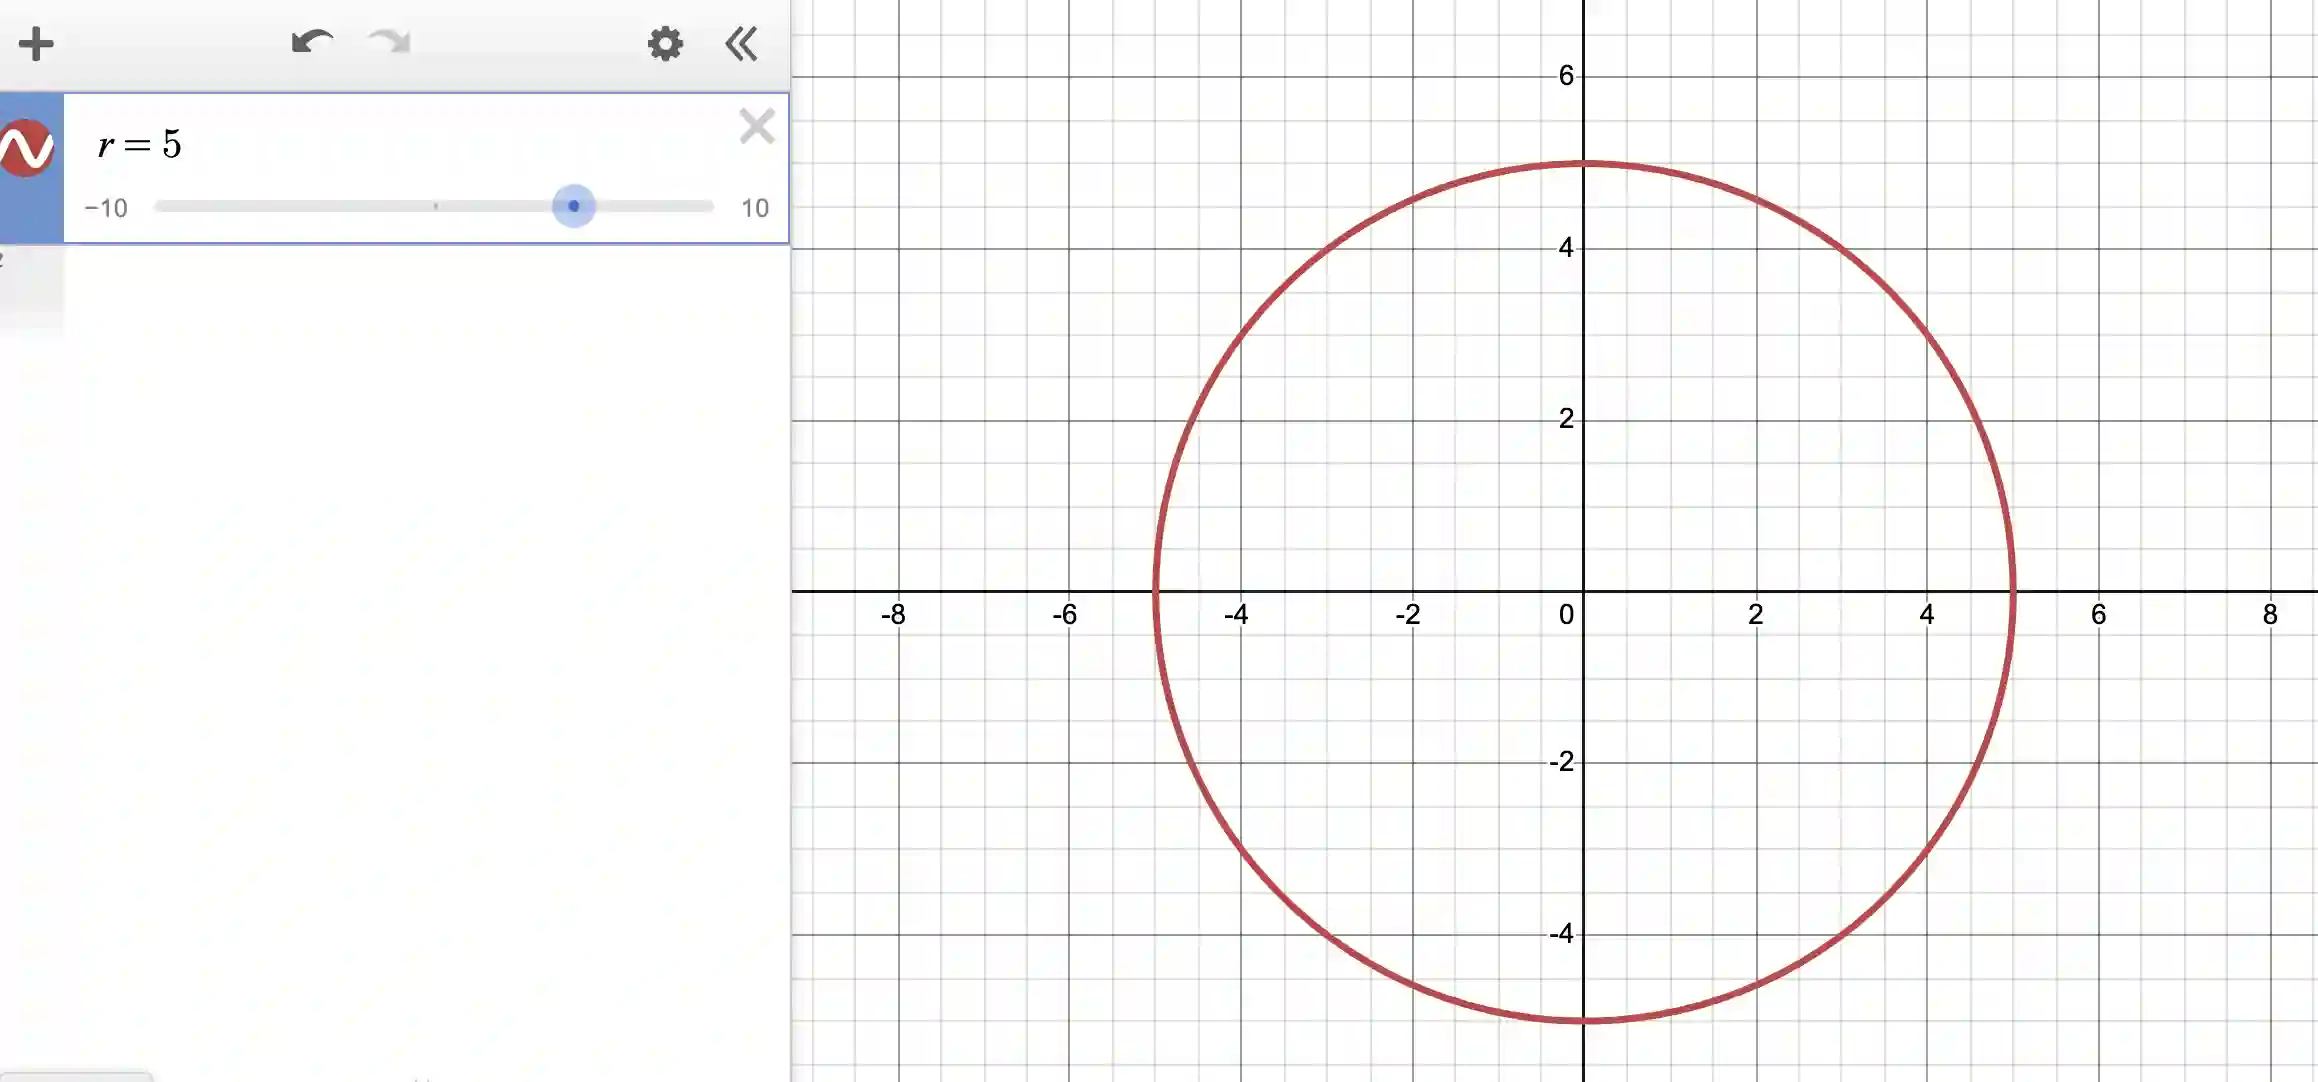
All we had to say was “r=5”! Desmos interprets the “r” for the radius in polar coordinates and assumes that because theta is not specified, all values of theta are applicable.
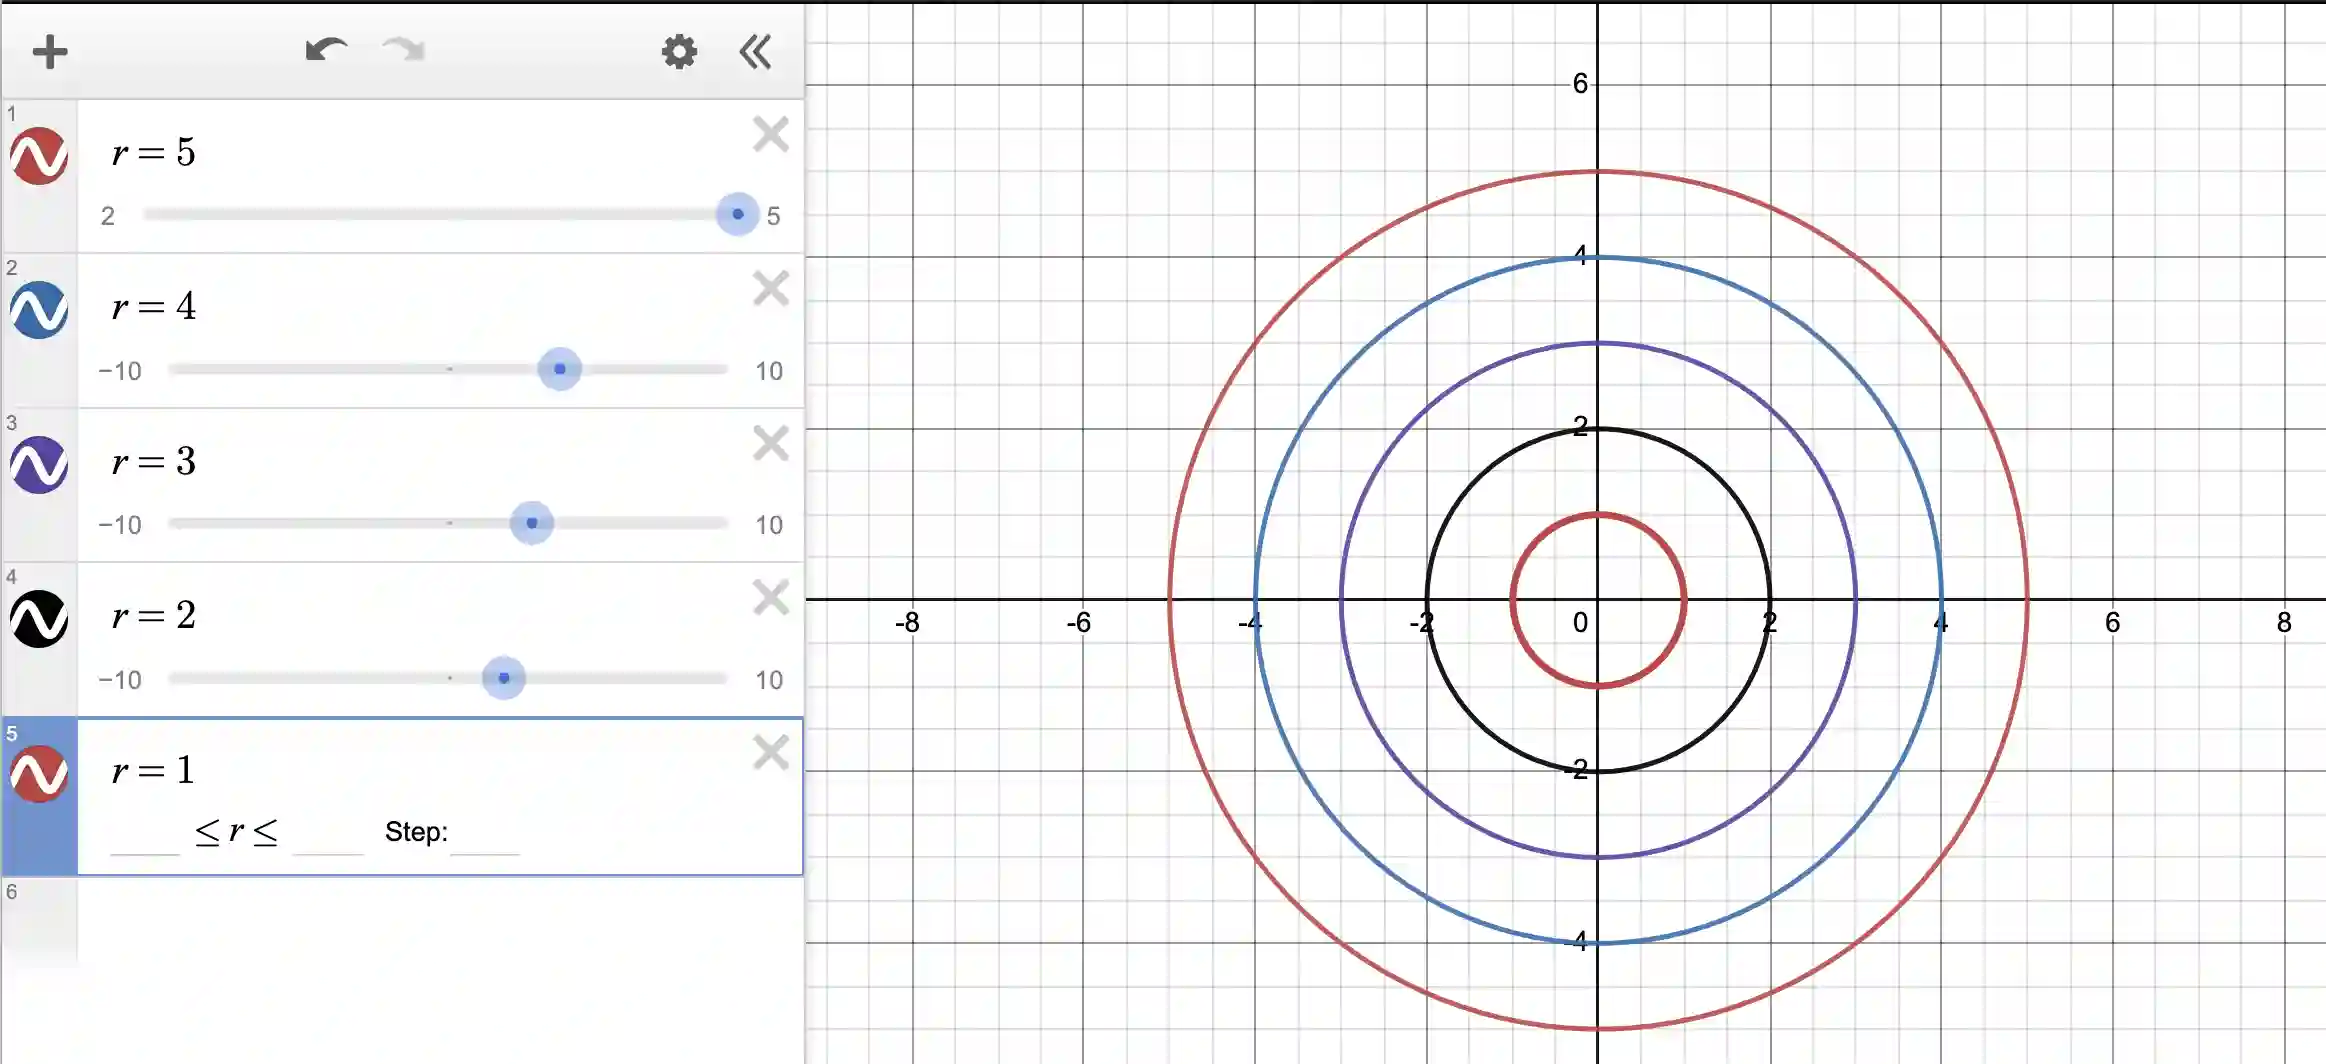
We can use this idea to easily create a set of concentric circles, like so:
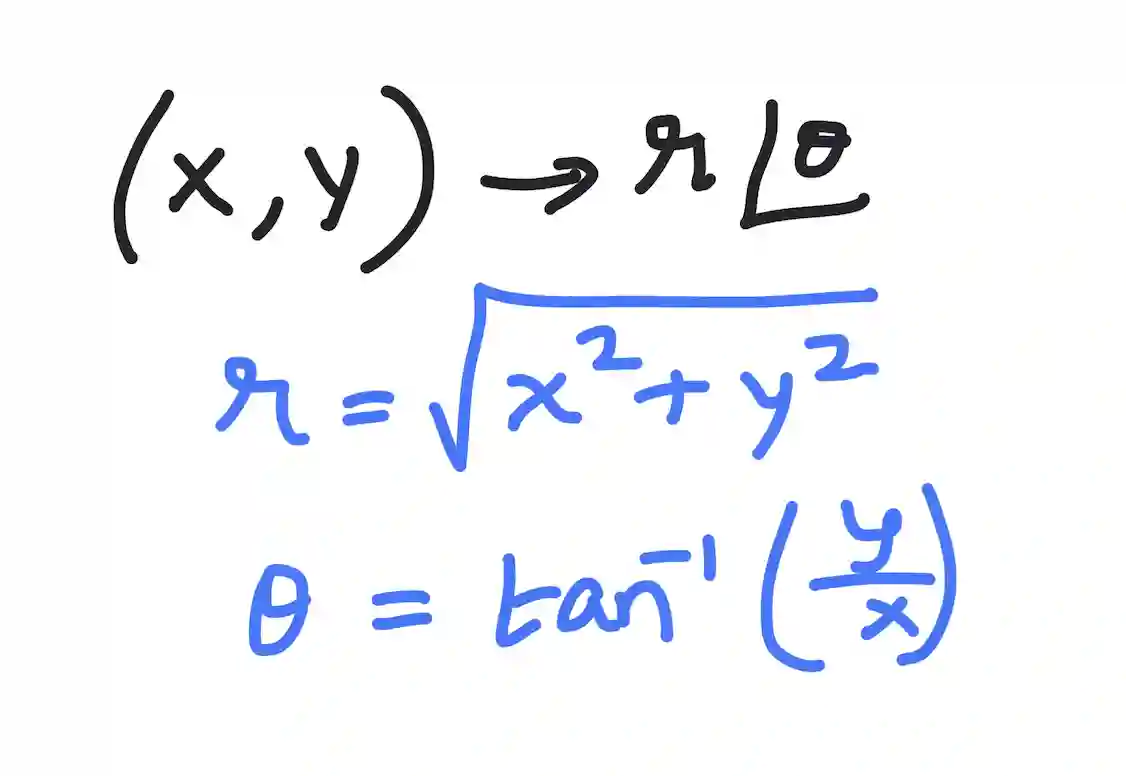
Converting from cartesian coordinates to polar coordinates
To convert from cartesian coordinates to polar coordinates, you can use the equations as shown below:
(Btw, as you experiment with different coordinate systems, if you are working with polygons whose vertices have integer coordinates, Pick's Theorem provides a simple formula to determine their area. This can be a valuable tool when analyzing shapes in different coordinate systems.)
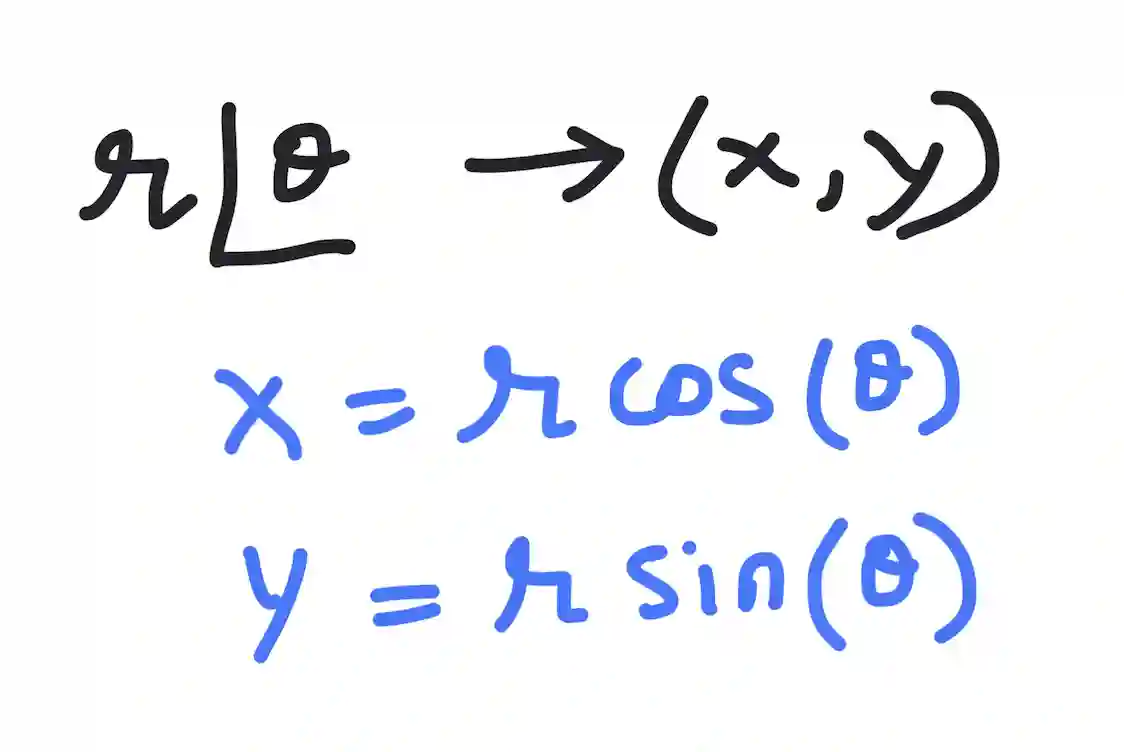
Converting from polar coordinates to cartesian coordinates
To do the reverse, we need to just invert the calculations above:
Drawing a sector in Desmos using polar coordinates
Furthermore, it is easy to create a “sector” of a circle by specifying the range of angles (instead of the default 0 to 360 degrees, or 0 to 2 pi radians).
Below is an example:
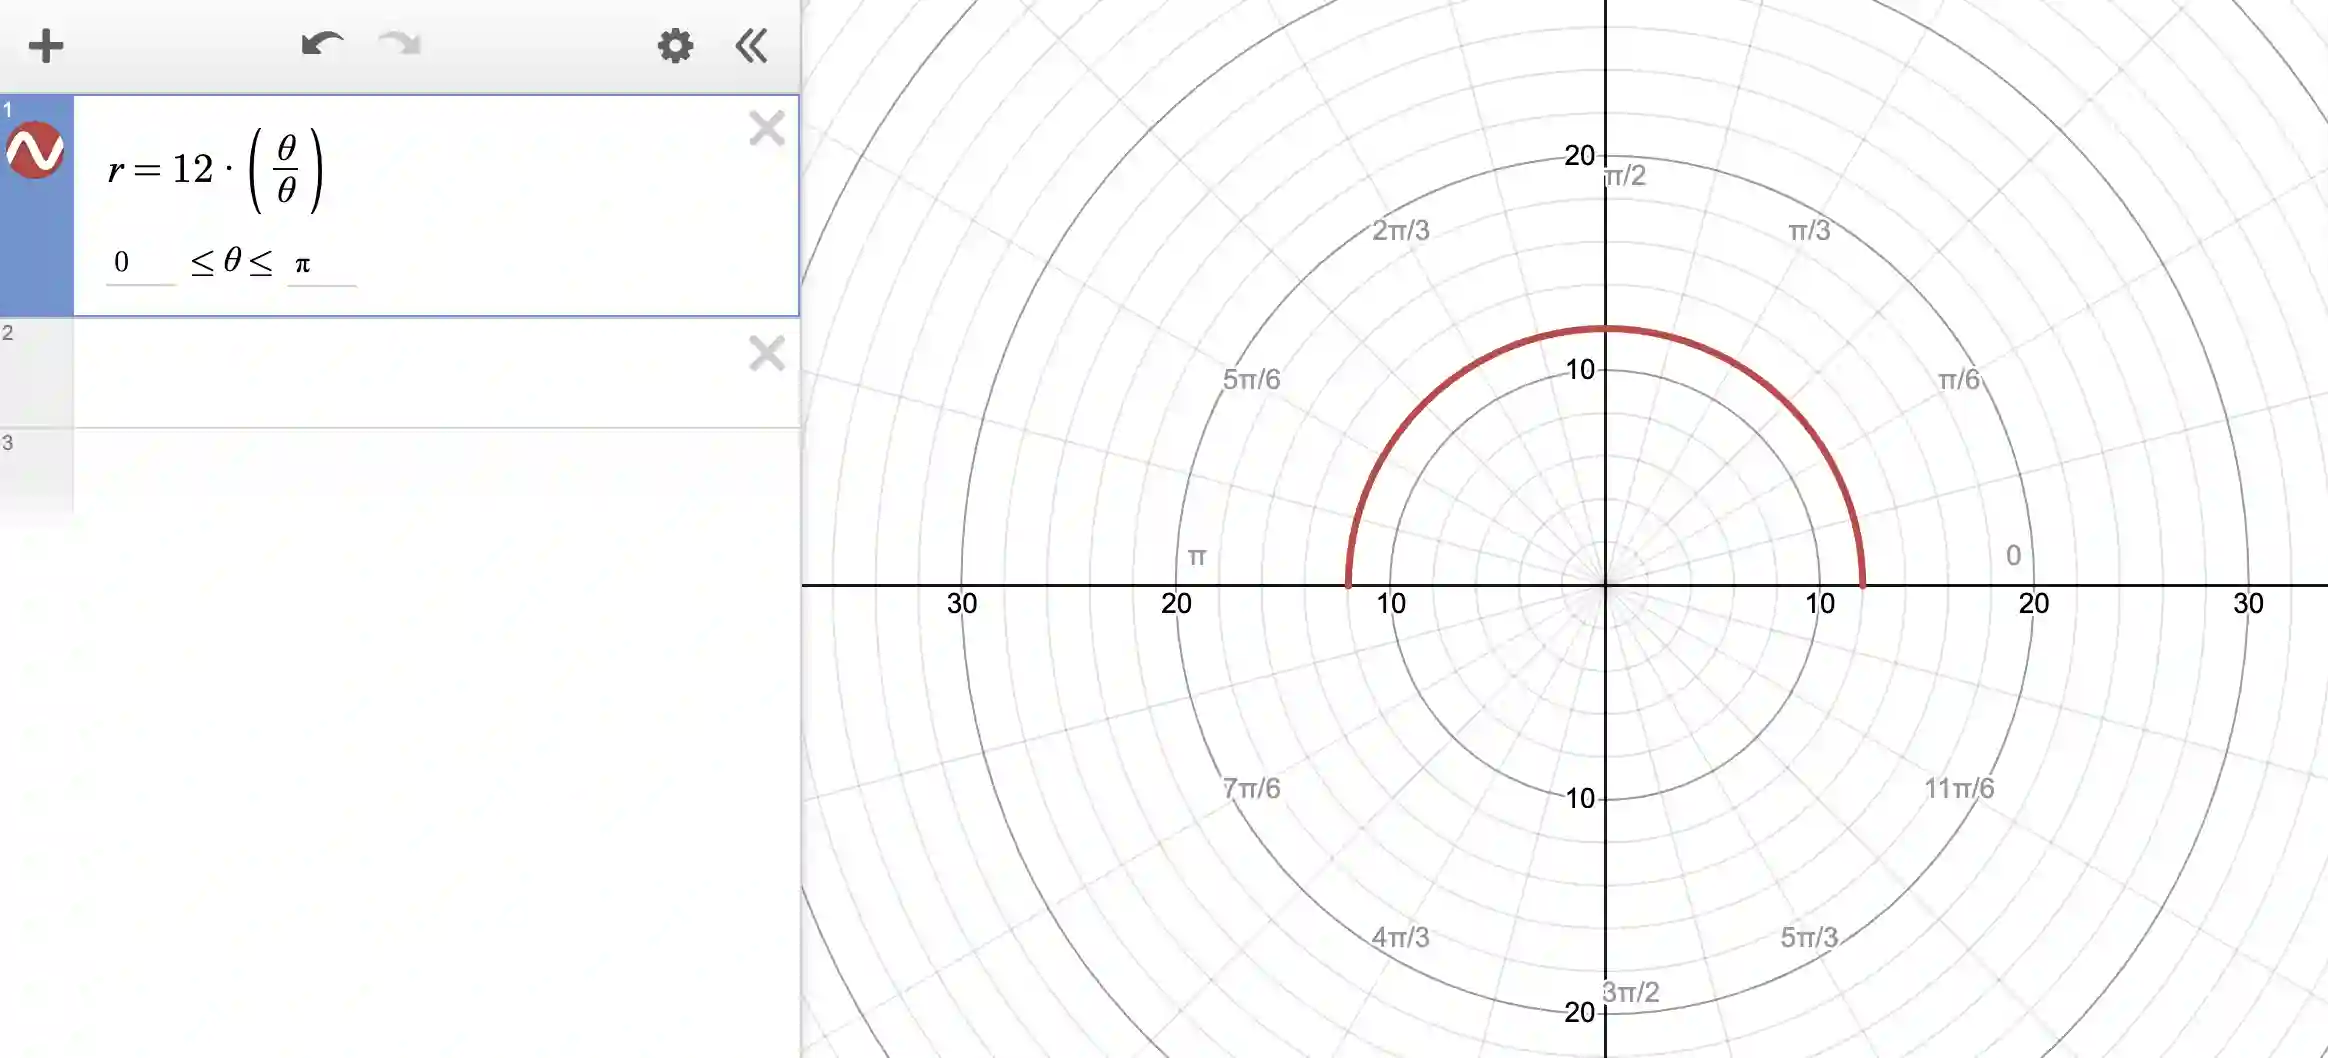
Here we are really interested in radius = 12. But we also need to specify a range of theta, so we add a dummy theta/theta as a term. It really doesn’t modify the radius but it adds a slider/range for us for theta. In the range for theta, we say we want only a sector from 0 to 180 degrees (here, specified as 0 to pi radians), and thus we get a semicircle. Try other ranges to get interesting sectors!
Drawing a spiral in Desmos using polar coordinates
To draw a spiral, use the simple equation r = theta:
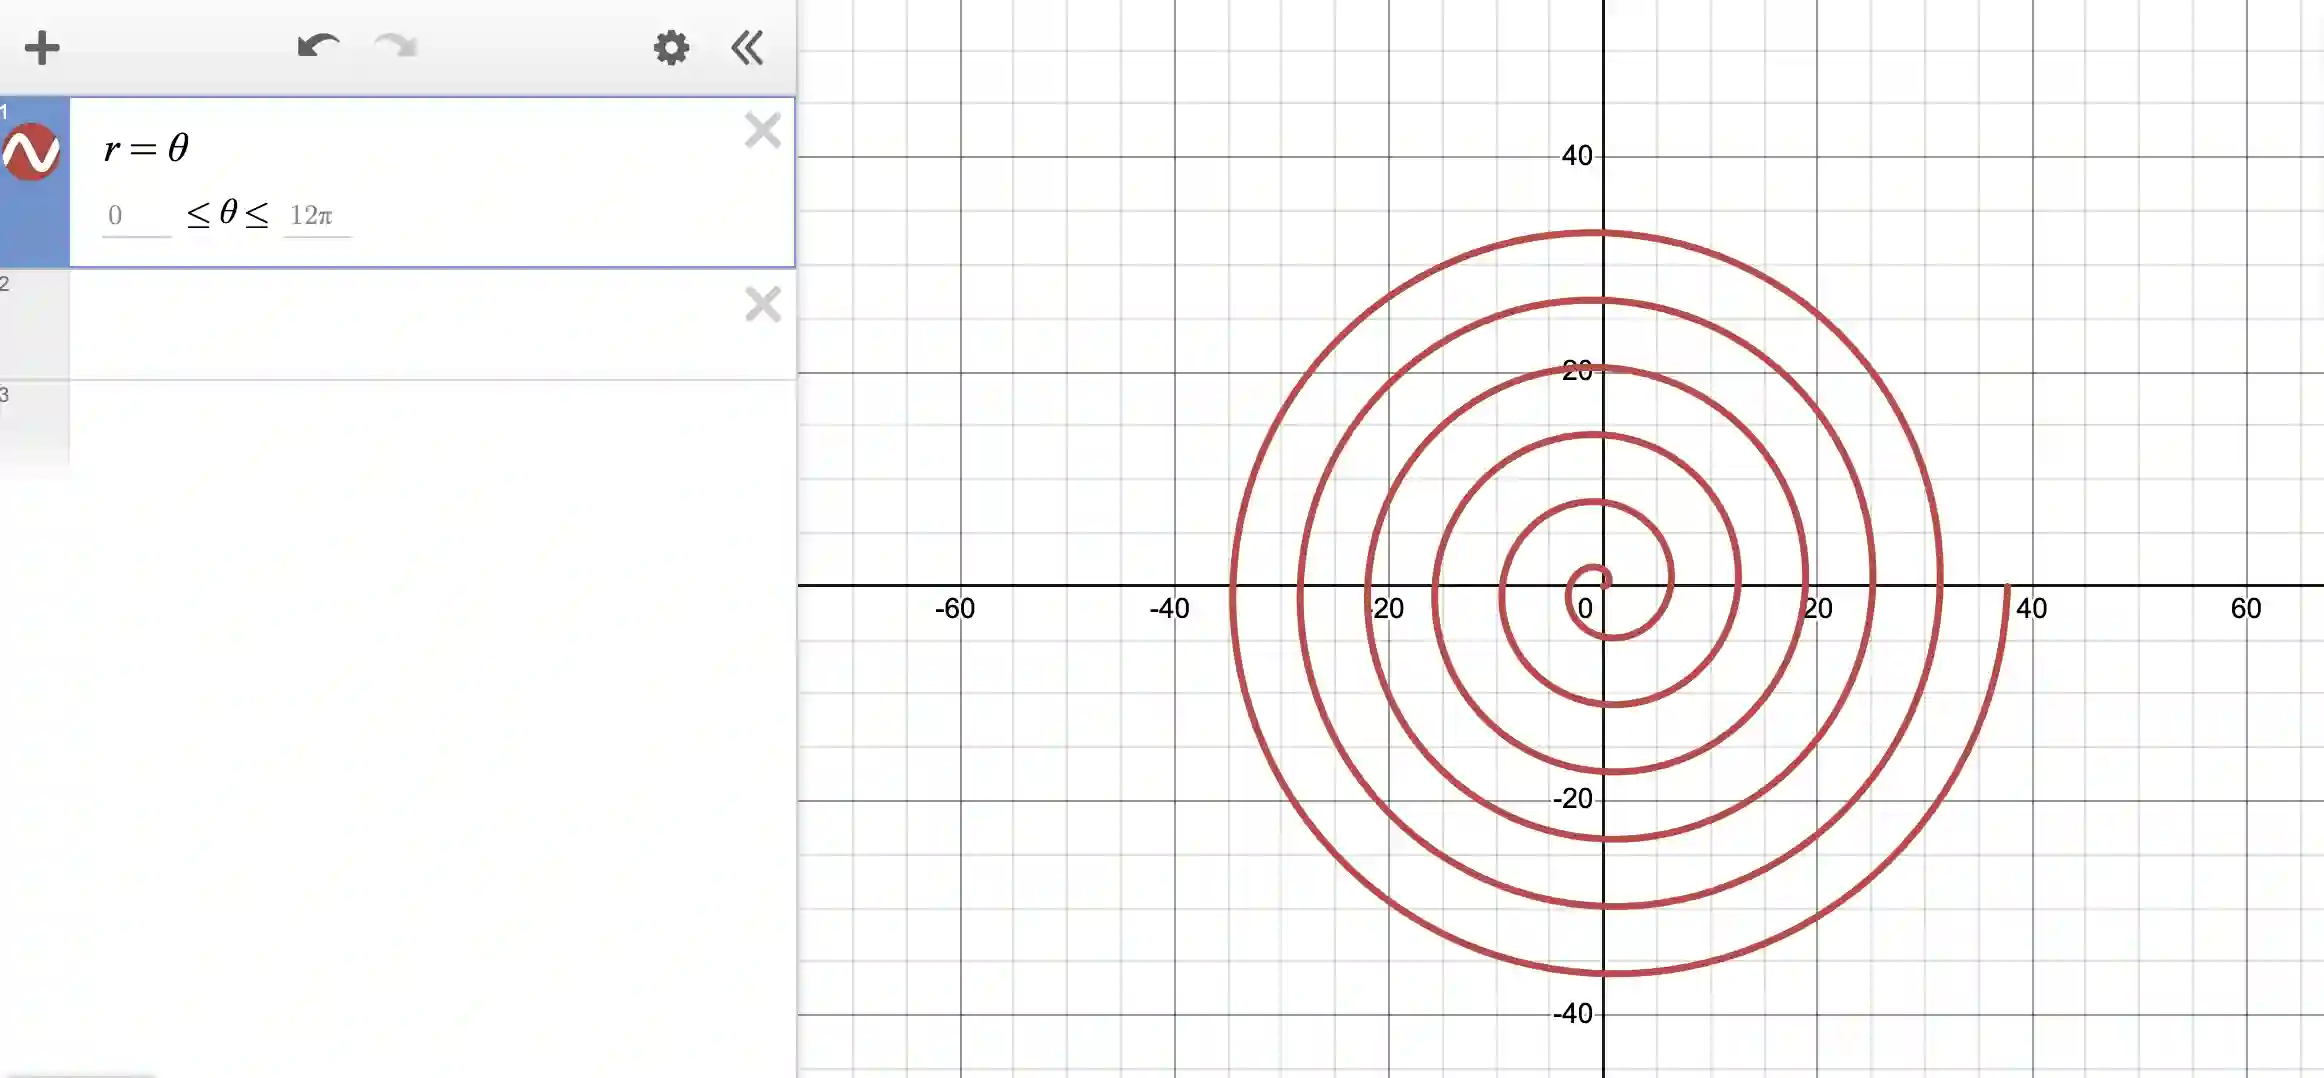
Why does this simple equation return a spiral? This is because as the angle θ increases, the distance from the origin (r) also increases. This creates a spiral pattern as you move around the center. In polar coordinates, the angle θ is paired with the distance r from the origin, and as θ increases, r also increases, resulting in the formation of a spiral pattern. This behavior is specific to the polar coordinate system, where the combination of r and θ produces various spiral shapes and other polar patterns.
We hope all the above examples give you a great taste of polar coordinates!
If you liked this blogpost and would like more experience with Desmos, learn how to make a heart shape with Desmos! Also learn about more geometric designs in Desmos!
If you enjoyed this blogpost, learn about math quadrants next! Explore Kodeclik’s Math courses and bootcamps! For more math fun, checkout our blog post on generating random numbers and on 100+ middle school math games.
